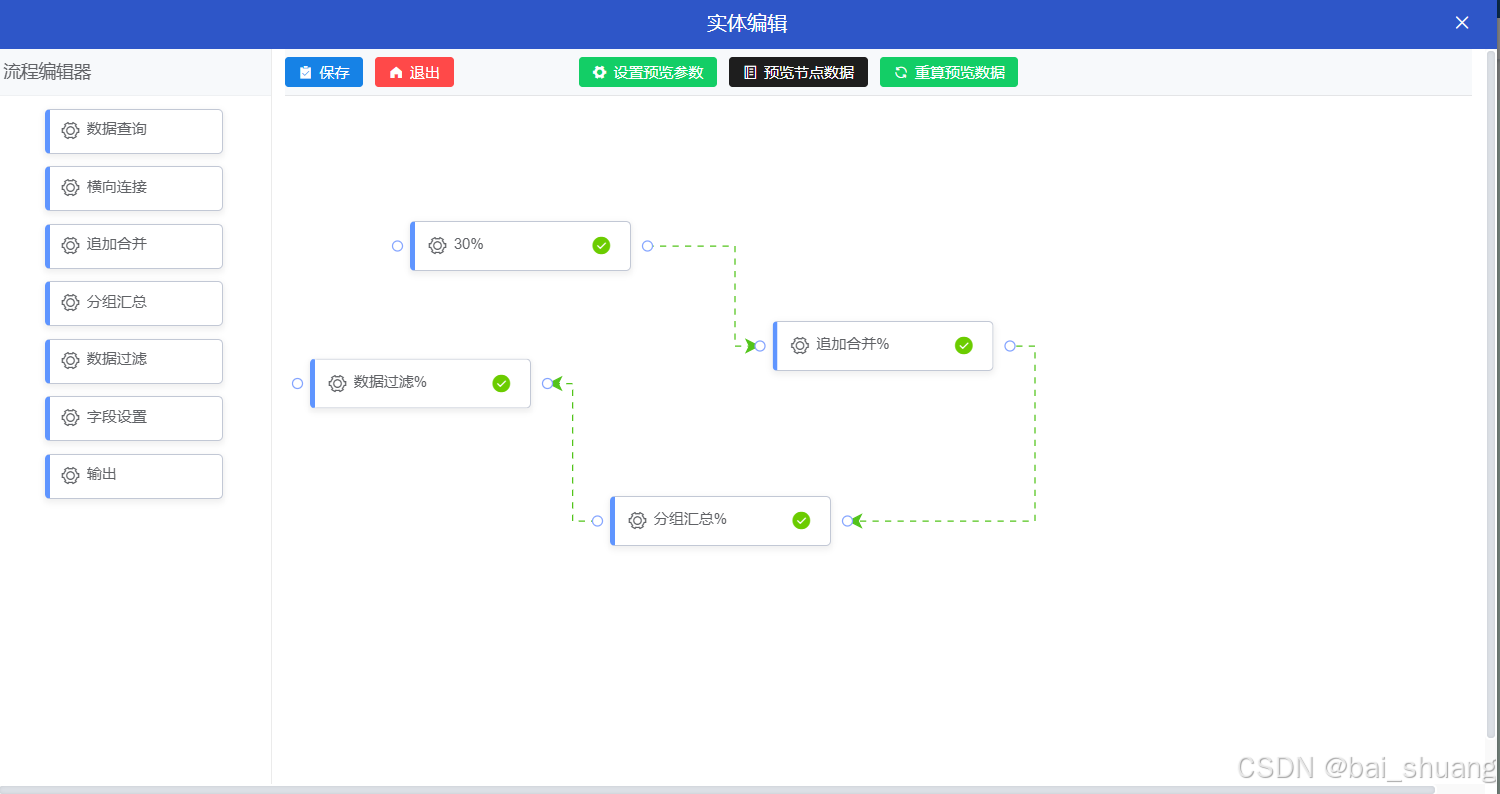
@antv/x6 再vue中 ,自定义图形,画流程图、数据建模、er图等图形
X6 是基于 HTML 和 SVG 的图编辑引擎,提供低成本的定制能力和开箱即用的内置扩展,方便我们快速搭建 DAG 图、ER 图、流程图、血缘图等应用。
最终效果图

1.安装
npm install @antv/x6 --save //x6主要包
npm install @antv/x6-vue-shape //使用vue组件画图插件
npm install @antv/x6-plugin-dnd //拖拽 添加元素图形插件
2.直接上代码
dom元素 form.vue
<template>

    <!-- 新增、编辑弹窗-->
    <el-dialog width="1200px" class="flow-dialog" top="5vh" title="实体编辑" :visible.sync="show" :append-to-body="true" :close-on-click-modal = "false" v-el-drag-dialog>
      <div class="content">
        <!--左侧工具栏-->
        <div class="stencil" >
          <p>流程编辑器</p>
          <span @mousedown="startDragToGraph(item, $event)" v-for="item in list" :key="item" @click="test(item)" class="percentage-value">
            <i style="margin-right: 5px;cursor: pointer;"  class="el-icon-setting"/>
            <span class="percentage-content">{{ item }}</span>
          </span>
        </div>
        <div class="panel">
          <!--流程图工具栏-->
          <div class="toolbar">
            <el-button class="float-btn" icon="el-icon-s-claim" type="primary" @click="save()">保存</el-button>
            <el-button class="float-btn" icon="el-icon-s-home" type="danger" @click="show=false">退出</el-button>
            <el-button style="margin-left: 100px;" class="float-btn" icon="el-icon-s-tools" type="success" @click="">设置预览参数</el-button>
            <el-button class="float-btn" icon="el-icon-notebook-2" type="info" @click="">预览节点数据</el-button>
            <el-button class="float-btn" icon="el-icon-refresh" type="success" @click="">重算预览数据</el-button>
          </div>
          <!--流程图画板-->
          <div id="containerShape" />
        </div>
      </div>
    </el-dialog>

</template>
js部分
<script>
 import elDragDialog from '@/directive/el-drag-dialog'
  import { register } from '@antv/x6-vue-shape'
  import { Graph,Shape} from "@antv/x6";
  import CustomNode from './CustomNode.vue'
  import { Dnd } from '@antv/x6-plugin-dnd'

  export default {
    directives: { elDragDialog },
    data() {
      return {
        show:false,
        list: ['数据查询', '横向连接', '追加合并', '分组汇总', '数据过滤','字段设置','输出'],
        graph:{}
      }
    },
    mounted() {
      const attrs = {
        circle: {
          r: 4,
          magnet: true,
          fill: '#fff',
          stroke: '#85A5FF',
          strokeWidth: 1,
        },
      };
      register({
        shape: 'custom-vue-node',
        component: CustomNode,
        width: 180,
        height: 40,
        // port默认不可见
        ports: {
          groups: {
            in: {
              position: {
                name:'left',
                args: {
                  dx: -10,
                  y: '50%',
                },
              },
              attrs: attrs
            },
            out: {
              position: {
                name:'right',
                args: {
                  x: '100%',
                  dx: 10,
                  y: '50%',
                },
              },
              attrs: attrs
            },
          },
        },
      })
    },
    methods: {
      open() {
        this.show = true;
        this.$nextTick(() => {
          this.init("containerShape");
        });
      },
      init(id){
        const graph = new Graph({
          container: document.getElementById(id),
          width: 1000,
          height: 1000,
          connecting: {
            router: 'manhattan',
            anchor: 'center',
            connectionPoint: 'anchor',
            createEdge() {
              return new Shape.Edge({
                attrs: {
                  line: {
                    stroke: '#52c41a',
                    strokeWidth: 1,
                    strokeDasharray: 5,
                    targetMarker: 'classic',
                    style: {
                      animation: 'ant-line 30s infinite linear',
                    },
                  },
                },
                zIndex: 0,
              })
            },
          }
        })
        graph.addNode({
          shape: 'custom-vue-node',
          x: 100,
          y: 100,
          ports: [{group: 'in'},{group: 'out'}],
          data:{
            percentage: 30
          }
        })


        this.graph = graph;
     },
      save() {
       this.graph.addNode({
         shape: 'custom-vue-node',
         x: 200,
         y: 300,
         ports: [{group: 'in'},{group: 'out'}],
         data:{
           percentage: '数据流程飒飒飒飒拉开阿斯兰的卡死了的科目来打开'
         }
       })
      },
      // 自定义一个拖拽方法,也可以单独封装成一个js文件(方便调用)
      // 这里直接写到vue文件的methods方法里了
      // 需求:未置灰的可以拖拽,置灰的无法拖拽即禁用状态
      startDragToGraph(item, e) {
          const node = this.graph.createNode({
            shape: 'custom-vue-node',
            x: 200,
            y: 300,
            ports: [{group: 'in'},{group: 'out'}],
            data:{
              percentage: item
            }
          });
          const dnd = new Dnd({
            target: this.graph,
            // ☆拖拽结束时,验证节点是否可以放置到目标画布中。
            validateNode: () => {
              console.log('成功拖拽至目标画布')
            },
          })
          dnd.start(node, e)
      },

    }
  }
</script>
css部分
<style type="text/css">
  @keyframes ant-line {
    to {
    stroke-dashoffset: -1000
    }
  }
</style>

<style type="text/css" scoped>
  .flow-dialog ::v-deep .el-dialog__body{
    max-height: 85vh;
    padding: 0;
  }
  .toolbar ::v-deep .el-button--small{
    padding: 5px 10px;
  }
  .content {
    width: 1180px;
    height: 85vh;
    display: flex;
  }

  .stencil {
    width: 230px;
    height: 100%;
    position: relative;
    margin-right: 10px;
    border-right: 1px solid rgba(0, 0, 0, 0.08);
    box-sizing: border-box;
    text-align: center;
  }
  .stencil p{
     margin: 0;
     line-height: 37px;
     border-bottom: 1px solid #00000008;
     background-color: #f7f9fb;
     font-size: 14px;
     padding-left: 5px;
     text-align: left;
   }
  .panel {
    width: calc(100% - 230px);
    height: 100%;
  }

  .panel .toolbar {
    width: 100%;
    height: 38px;
    display: flex;
    align-items: center;
    background-color: #f7f9fb;
    border-bottom: 1px solid rgba(0, 0, 0, 0.08);
  }

  .panel #containerShape {
    width: 100%;
    height: calc(100% - 10px) !important;
  }

  .percentage-value{
    display: inline-block;
    width: max-content;
    background-color: #fff;
    border: 1px solid #c2c8d5;
    border-left: 4px solid #5F95FF;
    border-radius: 4px;
    box-shadow: 0 2px 5px 1px rgba(0, 0, 0, 0.06);
    padding: 8px;
    font-size: 16px;
    margin-top: 10px;
    text-align: left;
  }
  .percentage-content{
    width: 100px;
    max-width: 150px;
    overflow: hidden;
    font-size: 12px;
    display: inline-block;
  }

</style>
CustomNode.vue节点元素dom
<template>
  <span class="percentage-value">
    <i style="margin-right: 5px;cursor: pointer;" @click="save()" class="el-icon-setting"/>
    <span class="percentage-content">{{ percentage }}%</span>
    <i @click="save()" class="el-icon-success data-start"/>
  </span>
</template>


<script>
  export default {
    inject: ['getNode'],
    data() {
      return {
        percentage: 50,
      }
    },
    mounted() {
      const cell = this.getNode();
      this.percentage = cell.data.percentage;
    },
    methods: {
      save(){
        console.log("点击成功")
      }
    }
  }
</script>
<style type="text/css" scoped>
 .percentage-value{
   display: inline-block;
   width: max-content;
   background-color: #fff;
   border: 1px solid #c2c8d5;
   border-left: 4px solid #5F95FF;
   border-radius: 4px;
   box-shadow: 0 2px 5px 1px rgba(0, 0, 0, 0.06);
   padding: 10px;
   font-size: 16px;
 }
 .percentage-content{
   width: 100px;
   max-width: 150px;
   overflow: hidden;
   font-size: 12px;
   display: inline-block;
 }
  .data-start{
    margin-right: 5px;
    margin-left: 10px;
    cursor: pointer;
    color: #6bcc00;
  }
</style>
相关官方文档x6.antv官网
原文地址:https://blog.csdn.net/bai_shuang/article/details/144130973
免责声明:本站文章内容转载自网络资源,如本站内容侵犯了原著者的合法权益,可联系本站删除。更多内容请关注自学内容网(zxcms.com)!
