[云] DockerCoin 遇到问题记录
1
ubuntu@ip-172-31-26-240:~$ scp -i "D:\A\AWS\EricTrial.pem" "D:\A\AWS\cloud-fall24-ass2.zip" ubuntu@34.207.116.162:/home/ubuntu/
Warning: Identity file D:\A\AWS\EricTrial.pem not accessible: No such file or directory.
The authenticity of host '34.207.116.162 (34.207.116.162)' can't be established.
ED25519 key fingerprint is SHA256:rq0zv/1A2in7V5ayu5c0FjD/rmingLH3QEFugrSYXWc.
This key is not known by any other names.
Are you sure you want to continue connecting (yes/no/[fingerprint])?
这是尝试在远端自己上传给自己了,输入yes是可以的
应该调用管理员权限用PowerShell传送。
PS C:\Windows\system32> scp -i "D:\\A\\AWS\\EricTrial.pem" "D:\\A\\AWS\\cloud-fall24-ass2.zip" ubuntu@34.207.116.162:/home/ubuntu/
cloud-fall24-ass2.zip
cloud-fall24-ass2.zip 100% 6632 25.5KB/s 00:00ubuntu@ip-172-31-26-240:~$ ls
cloud-fall24-ass2.zip2
ubuntu@ip-172-31-26-240:~$ unzip cloud-fall24-ass2.zip
Command 'unzip' not found, but can be installed with:
sudo apt install unzip
ubuntu@ip-172-31-26-240:~$ sudo apt install unzip
Reading package lists... Done
Building dependency tree... Done
Reading state information... Done
Suggested packages:
zip
The following NEW packages will be installed:
unzip
0 upgraded, 1 newly installed, 0 to remove and 0 not upgraded.
Need to get 175 kB of archives.
After this operation, 384 kB of additional disk space will be used.
Get:1 http://us-east-1.ec2.archive.ubuntu.com/ubuntu noble/main amd64 unzip amd64 6.0-28ubuntu4 [175 kB]
Fetched 175 kB in 0s (7847 kB/s)
Selecting previously unselected package unzip.
(Reading database ... 67836 files and directories currently installed.)
Preparing to unpack .../unzip_6.0-28ubuntu4_amd64.deb ...
Unpacking unzip (6.0-28ubuntu4) ...
Setting up unzip (6.0-28ubuntu4) ...
Processing triggers for man-db (2.12.0-4build2) ...
Scanning processes...
Scanning linux images...
Running kernel seems to be up-to-date.
No services need to be restarted.
No containers need to be restarted.
No user sessions are running outdated binaries.
No VM guests are running outdated hypervisor (qemu) binaries on this host.ubuntu@ip-172-31-26-240:~$ unzip cloud-fall24-ass2.zip
Archive: cloud-fall24-ass2.zip
inflating: dockercoins.yaml
inflating: hpa.yaml
inflating: httplat.yaml
inflating: README.md 3
ubuntu@ip-172-31-26-240:~$ curl -LO https://storage.googleapis.com/minikube/releases/latest/minikube-linux-amd64
  % Total    % Received % Xferd  Average Speed   Time    Time     Time  Current
                                 Dload  Upload   Total   Spent    Left  Speed
100 99.0M  100 99.0M    0     0  15.7M      0  0:00:06  0:00:06 --:--:-- 15.9M
ubuntu@ip-172-31-26-240:~$ sudo install minikube-linux-amd64 /usr/local/bin/minikube
ubuntu@ip-172-31-26-240:~$ curl -LO "https://dl.k8s.io/release/$(curl -L -s https://dl.k8s.io/release/stable.txt)/bin/linux/amd64/kubectl"
  % Total    % Received % Xferd  Average Speed   Time    Time     Time  Current
                                 Dload  Upload   Total   Spent    Left  Speed
100   138  100   138    0     0   1770      0 --:--:-- --:--:-- --:--:--  1792
100 53.7M  100 53.7M    0     0  22.5M      0  0:00:02  0:00:02 --:--:-- 23.7M
ubuntu@ip-172-31-26-240:~$ sudo install -o root -g root -m 0755 kubectl /usr/local/bin/kubectl
在您运行的 sudo install 命令之后,如果没有任何错误输出,这通常表示命令已成功执行。install 命令默认不会提供任何成功的输出,除非有问题发生。因此,您当前遇到的情况是正常的。
您可以通过以下步骤确认 kubectl 是否已成功安装:
1. 检查 kubectl 是否安装成功
运行以下命令来检查 kubectl 版本,如果成功安装,它会返回版本号:
kubectl version --client
如果显示类似以下信息:
Client Version: version.Info{Major:"1", Minor:"21", GitVersion:"v1.21.1", ...}
则表示 kubectl 已正确安装。
2. 验证 Minikube 是否成功安装
同样,您可以运行以下命令检查 Minikube 是否已正确安装:
minikube version
如果成功安装,您应该会看到 Minikube 的版本信息
4
ubuntu@ip-172-31-26-240:~$ curl -fsSL -o get_helm.sh https://raw.githubusercontent.com/helm/helm/master/scripts/get-helm-3
ubuntu@ip-172-31-26-240:~$ chmod 700 get_helm.sh
ubuntu@ip-172-31-26-240:~$ ./get_helm.sh
Downloading https://get.helm.sh/helm-v3.16.1-linux-amd64.tar.gz
Verifying checksum... Done.
Preparing to install helm into /usr/local/bin
helm installed into /usr/local/bin/helm
您当前运行的命令是在安装 Helm,这是 Kubernetes 中的一个包管理工具。以下是每个步骤的解释:
-
下载
get_helm.sh安装脚本:curl -fsSL -o get_helm.sh https://raw.githubusercontent.com/helm/helm/master/scripts/get-helm-3- 这个命令使用
curl下载了 Helm 的安装脚本get_helm.sh。这个脚本从 Helm 官方仓库获取 Helm 的安装文件并安装到您的系统中。
- 这个命令使用
-
修改
get_helm.sh脚本的权限:chmod 700 get_helm.sh- 这个命令使用
chmod修改脚本的权限,赋予它可执行权限(700代表文件拥有者可以读、写、执行)。
- 这个命令使用
-
运行
get_helm.sh脚本:./get_helm.sh- 该命令执行了刚刚下载的
get_helm.sh脚本,开始安装 Helm。
- 该命令执行了刚刚下载的
-
下载 Helm 并验证:
Downloading https://get.helm.sh/helm-v3.16.1-linux-amd64.tar.gz Verifying checksum... Done.- 脚本下载了 Helm 的可执行文件,并验证了下载文件的完整性(通过校验和检查)。Helm 的文件名为
helm-v3.16.1-linux-amd64.tar.gz,这是 Helm 3.16.1 版本的 Linux 可执行文件。
- 脚本下载了 Helm 的可执行文件,并验证了下载文件的完整性(通过校验和检查)。Helm 的文件名为
-
将 Helm 安装到
/usr/local/bin目录:Preparing to install helm into /usr/local/bin helm installed into /usr/local/bin/helm- 该脚本解压缩下载的 Helm 文件并将其安装到
/usr/local/bin目录。这个目录通常包含系统中的可执行文件,这样您可以直接通过命令行使用helm。
- 该脚本解压缩下载的 Helm 文件并将其安装到
5
ubuntu@ip-172-31-26-240:~$ minikube start
😄  minikube v1.34.0 on Ubuntu 24.04 (xen/amd64)
✨  Automatically selected the docker driver. Other choices: ssh, none
📌  Using Docker driver with root privileges
👍  Starting "minikube" primary control-plane node in "minikube" cluster
🚜  Pulling base image v0.0.45 ...
💾  Downloading Kubernetes v1.31.0 preload ...
    > preloaded-images-k8s-v18-v1...:  326.69 MiB / 326.69 MiB  100.00% 45.70 M
    > gcr.io/k8s-minikube/kicbase...:  487.86 MiB / 487.90 MiB  99.99% 45.39 Mi
🔥  Creating docker container (CPUs=2, Memory=2200MB) ...
🐳  Preparing Kubernetes v1.31.0 on Docker 27.2.0 ...
    ▪ Generating certificates and keys ...
    ▪ Booting up control plane ...
    ▪ Configuring RBAC rules ...
🔗  Configuring bridge CNI (Container Networking Interface) ...
🔎  Verifying Kubernetes components...
    ▪ Using image gcr.io/k8s-minikube/storage-provisioner:v5
🌟  Enabled addons: storage-provisioner, default-storageclass
🏄  Done! kubectl is now configured to use "minikube" cluster and "default" namespace by default
ubuntu@ip-172-31-26-240:~$ kubectl apply -f dockercoins.yaml
deployment.apps/hasher created
service/hasher created
deployment.apps/redis created
service/redis created
deployment.apps/rng created
service/rng created
deployment.apps/webui created
service/webui created
deployment.apps/worker createdubuntu@ip-172-31-26-240:~$ kubectl get po
NAME READY STATUS RESTARTS AGE
hasher-66c759cf4b-tcswb 1/1 Running 0 25s
redis-5657588f58-hr4gh 1/1 Running 0 25s
rng-846cc46f5b-t99fj 1/1 Running 0 25s
webui-78cf59b54c-pctfb 0/1 ContainerCreating 0 25s
worker-75b6469885-k98xt 0/1 ContainerCreating 0 24subuntu@ip-172-31-26-240:~$ minikube service webui
|-----------|-------|-------------|---------------------------|
| NAMESPACE | NAME | TARGET PORT | URL |
|-----------|-------|-------------|---------------------------|
| default | webui | 80 | http://192.168.49.2:30517 |
|-----------|-------|-------------|---------------------------|
🎉 Opening service default/webui in default browser...
👉 http://192.168.49.2:30517kubectl port-forward --address 0.0.0.0 <webui pod name> <local port>:<pod port>这里怎么填?
根据您提供的 kubectl get pods 输出,webui 的 Pod 名称是 webui-78cf59b54c-pctfb。因此,您可以使用以下命令将 webui 服务的端口转发到本地:
完整命令:
kubectl port-forward --address 0.0.0.0 webui-78cf59b54c-pctfb 8080:80
注意:kubectl port-forward 不会返回。要继续进行练习,需要打开另一个终端。
6
kubectl scale deployment worker --replicas=3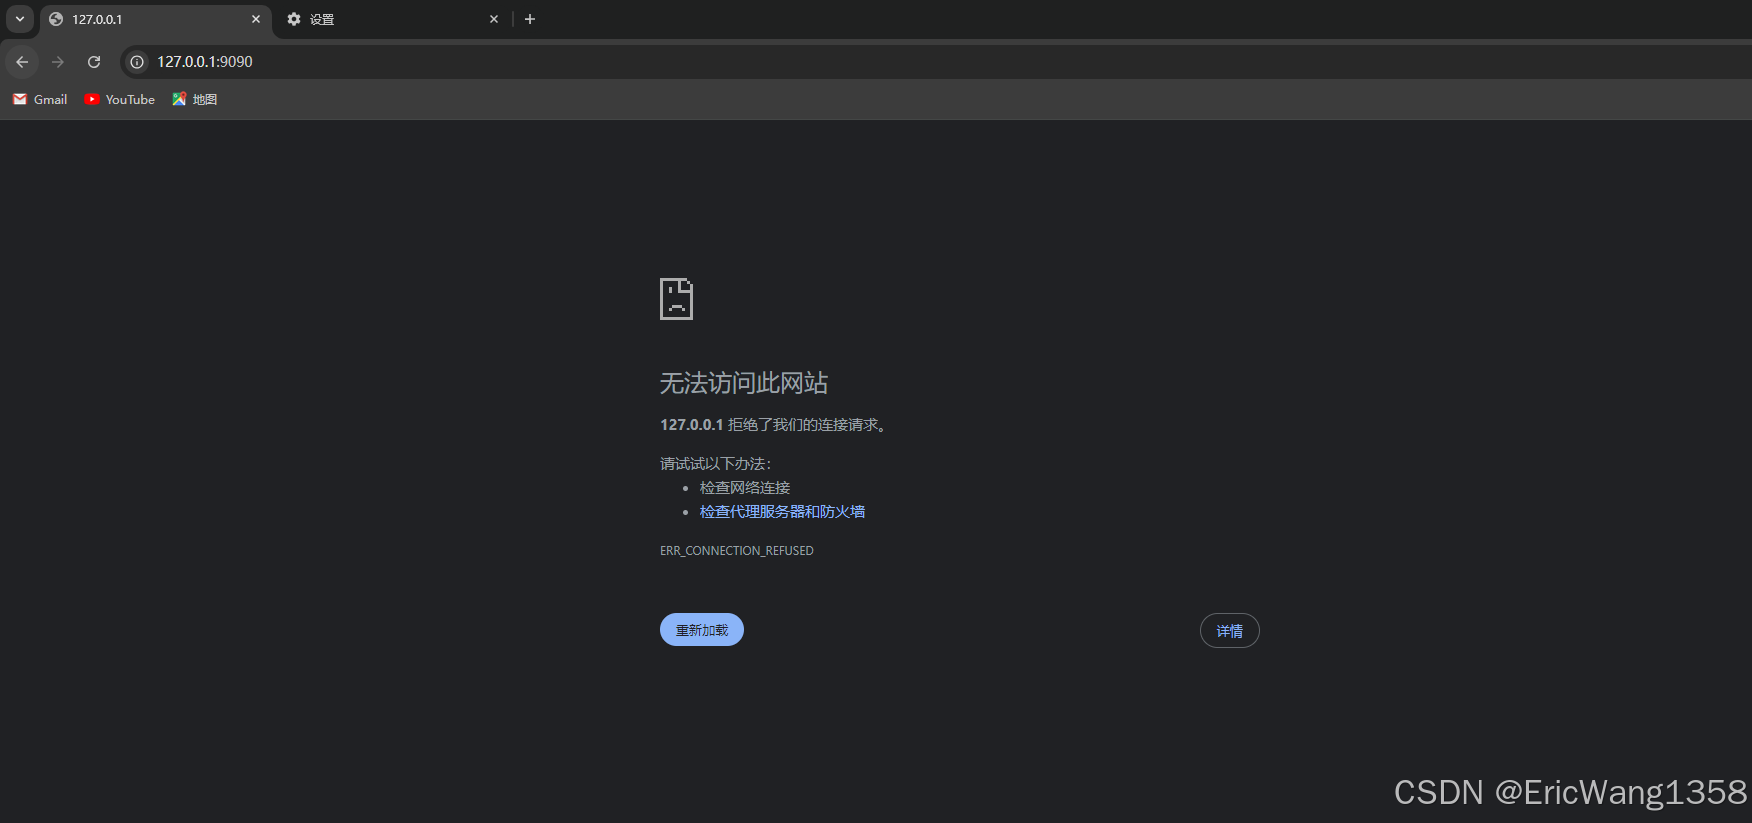
是实例的公有ip+9090,不是本地!
http://34.207.116.162:9090
7
ubuntu@ip-172-31-26-240:~$ kubectl expose service rng --type=NodePort --target-port=80 --name=rng-np
service/rng-np exposed
ubuntu@ip-172-31-26-240:~$ kubectl expose service hasher --type=NodePort --target-port=80 --name=hasher-np
service/hasher-np exposed
ubuntu@ip-172-31-26-240:~$ kubectl get svc rng-np hasher-np
NAME        TYPE       CLUSTER-IP      EXTERNAL-IP   PORT(S)        AGE
rng-np      NodePort   10.100.31.30    <none>        80:30433/TCP   21s
hasher-np   NodePort   10.102.226.95   <none>        80:32627/TCP   10s
ubuntu@ip-172-31-26-240:~$ kubectl cluster-info
Kubernetes control plane is running at https://192.168.49.2:8443
CoreDNS is running at https://192.168.49.2:8443/api/v1/namespaces/kube-system/services/kube-dns:dns/proxy

To further debug and diagnose cluster problems, use 'kubectl cluster-info dump'.
ubuntu@ip-172-31-26-240:~$ httping <minikube-address>:<hasher-np-port>
bash: syntax error near unexpected token newline'
1. 获取 Minikube 地址:
根据 kubectl cluster-info 的输出,Minikube 的控制面板地址是:
https://192.168.49.2:8443
所以 Minikube 地址是 192.168.49.2。
2. 获取 hasher 和 rng 的端口:
根据 kubectl get svc rng-np hasher-np 的输出:
rng-np的端口是30433。hasher-np的端口是32627。
3. 运行 httping 命令:
现在您可以使用 httping 命令检测这两个服务的延迟,格式如下:
# 检测 hasher 的延迟
httping 192.168.49.2:32627

# 检测 rng 的延迟
httping 192.168.49.2:30433
ubuntu@ip-172-31-26-240:~$ httping 192.168.49.2:32627
PING 192.168.49.2:32627 (/):
connected to 192.168.49.2:32627 (210 bytes), seq=0 time=  1.72 ms
connected to 192.168.49.2:32627 (210 bytes), seq=1 time=  2.30 ms
connected to 192.168.49.2:32627 (210 bytes), seq=2 time=  1.19 ms
connected to 192.168.49.2:32627 (210 bytes), seq=3 time=  1.18 ms
connected to 192.168.49.2:32627 (210 bytes), seq=4 time=  2.24 ms
connected to 192.168.49.2:32627 (210 bytes), seq=5 time=  1.21 ms
connected to 192.168.49.2:32627 (210 bytes), seq=6 time=  1.23 ms
connected to 192.168.49.2:32627 (210 bytes), seq=7 time=  2.57 ms
connected to 192.168.49.2:32627 (210 bytes), seq=8 time=  1.21 ms
connected to 192.168.49.2:32627 (210 bytes), seq=9 time=  1.09 ms
connected to 192.168.49.2:32627 (210 bytes), seq=10 time=  0.97 ms
connected to 192.168.49.2:32627 (210 bytes), seq=11 time=  1.16 ms
connected to 192.168.49.2:32627 (210 bytes), seq=12 time=  1.24 ms
connected to 192.168.49.2:32627 (210 bytes), seq=13 time=  5.27 ms
connected to 192.168.49.2:32627 (210 bytes), seq=14 time=  1.21 ms
connected to 192.168.49.2:32627 (210 bytes), seq=15 time=  1.21 ms
connected to 192.168.49.2:32627 (210 bytes), seq=16 time=  1.04 ms
connected to 192.168.49.2:32627 (210 bytes), seq=17 time=  2.91 ms
connected to 192.168.49.2:32627 (210 bytes), seq=18 time=  1.23 ms
connected to 192.168.49.2:32627 (210 bytes), seq=19 time=  1.17 ms
connected to 192.168.49.2:32627 (210 bytes), seq=20 time=  2.44 ms
^CGot signal 2
--- http://192.168.49.2:32627/ ping statistics ---
21 connects, 21 ok, 0.00% failed, time 20688ms
round-trip min/avg/max = 1.0/1.7/5.3 ms
ubuntu@ip-172-31-26-240:~$ httping -c 20 192.168.49.2:30433
PING 192.168.49.2:30433 (/):
connected to 192.168.49.2:30433 (158 bytes), seq=0 time=744.26 ms
connected to 192.168.49.2:30433 (158 bytes), seq=1 time=729.74 ms
connected to 192.168.49.2:30433 (158 bytes), seq=2 time=731.51 ms
connected to 192.168.49.2:30433 (158 bytes), seq=3 time=729.02 ms
connected to 192.168.49.2:30433 (158 bytes), seq=4 time=728.46 ms
connected to 192.168.49.2:30433 (158 bytes), seq=5 time=731.02 ms
connected to 192.168.49.2:30433 (158 bytes), seq=6 time=731.40 ms
connected to 192.168.49.2:30433 (158 bytes), seq=7 time=730.02 ms
connected to 192.168.49.2:30433 (158 bytes), seq=8 time=727.66 ms
connected to 192.168.49.2:30433 (158 bytes), seq=9 time=730.23 ms
connected to 192.168.49.2:30433 (158 bytes), seq=10 time=728.98 ms
connected to 192.168.49.2:30433 (158 bytes), seq=11 time=730.25 ms
connected to 192.168.49.2:30433 (158 bytes), seq=12 time=732.27 ms
connected to 192.168.49.2:30433 (158 bytes), seq=13 time=731.94 ms
connected to 192.168.49.2:30433 (158 bytes), seq=14 time=729.66 ms
connected to 192.168.49.2:30433 (158 bytes), seq=15 time=729.52 ms
connected to 192.168.49.2:30433 (158 bytes), seq=16 time=733.30 ms
connected to 192.168.49.2:30433 (158 bytes), seq=17 time=726.11 ms
connected to 192.168.49.2:30433 (158 bytes), seq=18 time=728.34 ms
connected to 192.168.49.2:30433 (158 bytes), seq=19 time=733.13 ms
--- http://192.168.49.2:30433/ ping statistics ---
20 connects, 20 ok, 0.00% failed, time 34621ms
round-trip min/avg/max = 726.1/730.8/744.3 ms8
ubuntu@ip-172-31-26-240:~$ helm repo add prometheus-community https://prometheus-community.github.io/helm-charts
"prometheus-community" has been added to your repositories
ubuntu@ip-172-31-26-240:~$ helm install prometheus prometheus-community/prometheus
NAME: prometheus
LAST DEPLOYED: Fri Oct  4 09:19:58 2024
NAMESPACE: default
STATUS: deployed
REVISION: 1
TEST SUITE: None
NOTES:
The Prometheus server can be accessed via port 80 on the following DNS name from within your cluster:
prometheus-server.default.svc.cluster.local


Get the Prometheus server URL by running these commands in the same shell:
  export POD_NAME=$(kubectl get pods --namespace default -l "app.kubernetes.io/name=prometheus,app.kubernetes.io/instance=prometheus" -o jsonpath="{.items[0].metadata.name}")
  kubectl --namespace default port-forward $POD_NAME 9090


The Prometheus alertmanager can be accessed via port 9093 on the following DNS name from within your cluster:
prometheus-alertmanager.default.svc.cluster.local


Get the Alertmanager URL by running these commands in the same shell:
  export POD_NAME=$(kubectl get pods --namespace default -l "app.kubernetes.io/name=alertmanager,app.kubernetes.io/instance=prometheus" -o jsonpath="{.items[0].metadata.name}")
  kubectl --namespace default port-forward $POD_NAME 9093
#################################################################################
######   WARNING: Pod Security Policy has been disabled by default since    #####
######            it deprecated after k8s 1.25+. use                        #####
######            (index .Values "prometheus-node-exporter" "rbac"          #####
###### .          "pspEnabled") with (index .Values                         #####
######            "prometheus-node-exporter" "rbac" "pspAnnotations")       #####
######            in case you still need it.                                #####
#################################################################################


The Prometheus PushGateway can be accessed via port 9091 on the following DNS name from within your cluster:
prometheus-prometheus-pushgateway.default.svc.cluster.local


Get the PushGateway URL by running these commands in the same shell:
  export POD_NAME=$(kubectl get pods --namespace default -l "app=prometheus-pushgateway,component=pushgateway" -o jsonpath="{.items[0].metadata.name}")
  kubectl --namespace default port-forward $POD_NAME 9091

For more information on running Prometheus, visit:
https://prometheus.io/
ubuntu@ip-172-31-26-240:~$ kubectl expose service prometheus-server --type=NodePort --target-port=9090 --name=prometheus-server-np
service/prometheus-server-np exposed
ubuntu@ip-172-31-26-240:~$ minikube addons list
|-----------------------------|----------|--------------|--------------------------------|
| ADDON NAME | PROFILE | STATUS | MAINTAINER |
|-----------------------------|----------|--------------|--------------------------------|
| ambassador | minikube | disabled | 3rd party (Ambassador) |
| auto-pause | minikube | disabled | minikube |
| cloud-spanner | minikube | disabled | Google |
| csi-hostpath-driver | minikube | disabled | Kubernetes |
| dashboard | minikube | disabled | Kubernetes |
| default-storageclass | minikube | enabled ✅ | Kubernetes |
| efk | minikube | disabled | 3rd party (Elastic) |
| freshpod | minikube | disabled | Google |
| gcp-auth | minikube | disabled | Google |
| gvisor | minikube | disabled | minikube |
| headlamp | minikube | disabled | 3rd party (kinvolk.io) |
| helm-tiller | minikube | disabled | 3rd party (Helm) |
| inaccel | minikube | disabled | 3rd party (InAccel |
| | | | [info@inaccel.com]) |
| ingress | minikube | disabled | Kubernetes |
| ingress-dns | minikube | disabled | minikube |
| inspektor-gadget | minikube | disabled | 3rd party |
| | | | (inspektor-gadget.io) |
| istio | minikube | disabled | 3rd party (Istio) |
| istio-provisioner | minikube | disabled | 3rd party (Istio) |
| kong | minikube | disabled | 3rd party (Kong HQ) |
| kubeflow | minikube | disabled | 3rd party |
| kubevirt | minikube | disabled | 3rd party (KubeVirt) |
| logviewer | minikube | disabled | 3rd party (unknown) |
| metallb | minikube | disabled | 3rd party (MetalLB) |
| metrics-server | minikube | disabled | Kubernetes |
| nvidia-device-plugin | minikube | disabled | 3rd party (NVIDIA) |
| nvidia-driver-installer | minikube | disabled | 3rd party (NVIDIA) |
| nvidia-gpu-device-plugin | minikube | disabled | 3rd party (NVIDIA) |
| olm | minikube | disabled | 3rd party (Operator Framework) |
| pod-security-policy | minikube | disabled | 3rd party (unknown) |
| portainer | minikube | disabled | 3rd party (Portainer.io) |
| registry | minikube | disabled | minikube |
| registry-aliases | minikube | disabled | 3rd party (unknown) |
| registry-creds | minikube | disabled | 3rd party (UPMC Enterprises) |
| storage-provisioner | minikube | enabled ✅ | minikube |
| storage-provisioner-gluster | minikube | disabled | 3rd party (Gluster) |
| storage-provisioner-rancher | minikube | disabled | 3rd party (Rancher) |
| volcano | minikube | disabled | third-party (volcano) |
| volumesnapshots | minikube | disabled | Kubernetes |
| yakd | minikube | disabled | 3rd party (marcnuri.com) |
|-----------------------------|----------|--------------|--------------------------------|
ubuntu@ip-172-31-26-240:~$ $ minikube addons enable metrics-server
$: command not found
ubuntu@ip-172-31-26-240:~$ minikube addons enable metrics-server
❌ Exiting due to MK_ADDON_ENABLE_PAUSED: enabled failed: get state: unknown state "minikube": docker container inspect minikube --format=<no value>: exit status 1
stdout:
stderr:
permission denied while trying to connect to the Docker daemon socket at unix:///var/run/docker.sock: Get "http://%2Fvar%2Frun%2Fdocker.sock/v1.24/containers/minikube/json": dial unix /var/run/docker.sock: connect: permission denied
╭───────────────────────────────────────────────────────────────────────────────────────────╮
│ │
│ 😿 If the above advice does not help, please let us know: │
│ 👉 https://github.com/kubernetes/minikube/issues/new/choose │
│ │
│ Please run `minikube logs --file=logs.txt` and attach logs.txt to the GitHub issue. │
│ Please also attach the following file to the GitHub issue: │
│ - /tmp/minikube_addons_ea1883bf3d48de40e3a8df972606fd50b6438bdc_0.log │
│ │
╰───────────────────────────────────────────────────────────────────────────────────────────╯
因为重启电脑/新建终端导致的命令权限设置问题,需要重新设置。
ubuntu@ip-172-31-26-240:~$ sudo usermod -aG docker $USER
ubuntu@ip-172-31-26-240:~$ newgrp docker
ubuntu@ip-172-31-26-240:~$ docker ps
CONTAINER ID   IMAGE                                 COMMAND                  CREATED             STATUS             PORTS                                                                                                                                  NAMES
8ad1b951304b   gcr.io/k8s-minikube/kicbase:v0.0.45   "/usr/local/bin/entr…"   About an hour ago   Up About an hour   127.0.0.1:32772->22/tcp, 127.0.0.1:32771->2376/tcp, 127.0.0.1:32770->5000/tcp, 127.0.0.1:32769->8443/tcp, 127.0.0.1:32768->32443/tcp   minikube
ubuntu@ip-172-31-26-240:~$ minikube addons enable metrics-server
💡  metrics-server is an addon maintained by Kubernetes. For any concerns contact minikube on GitHub.
You can view the list of minikube maintainers at: https://github.com/kubernetes/minikube/blob/master/OWNERS
    ▪ Using image registry.k8s.io/metrics-server/metrics-server:v0.7.2
🌟  The 'metrics-server' addon is enabled
9
ubuntu@ip-172-31-26-240:~$ kubectl apply -f httplat.yaml
deployment.apps/httplat created


ubuntu@ip-172-31-26-240:~$ kubectl expose deployment httplat --port=9080
service/httplat exposed


ubuntu@ip-172-31-26-240:~$ kubectl get deploy httplat
NAME      READY   UP-TO-DATE   AVAILABLE   AGE
httplat   1/1     1            1           18s


ubuntu@ip-172-31-26-240:~$ kubectl annotate service httplat \
          prometheus.io/scrape=true \
          prometheus.io/port=9080 \
          prometheus.io/path=/metrics
service/httplat annotated


ubuntu@ip-172-31-26-240:~$ kubectl get svc prometheus-server-np
NAME                   TYPE       CLUSTER-IP       EXTERNAL-IP   PORT(S)        AGE
prometheus-server-np   NodePort   10.109.237.135   <none>        80:30811/TCP   9m26s
ubuntu@ip-172-31-26-240:~$ kubectl get pods
NAME READY STATUS RESTARTS AGE
hasher-66c759cf4b-tcswb 1/1 Running 1 (4m7s ago) 83m
httplat-76994dbc8d-bkgkx 1/1 Running 0 4m13s
prometheus-alertmanager-0 1/1 Running 0 12m
prometheus-kube-state-metrics-75b5bb4bf8-7vmlt 1/1 Running 0 12m
prometheus-prometheus-node-exporter-rv9b2 1/1 Running 0 12m
prometheus-prometheus-pushgateway-84557d6c79-68jnr 1/1 Running 0 12m
prometheus-server-644d686bc6-h4pjf 1/2 ImagePullBackOff 0 12m
redis-5657588f58-hr4gh 1/1 Running 0 83m
rng-846cc46f5b-t99fj 1/1 Running 0 83m
webui-78cf59b54c-pctfb 1/1 Running 0 83m
worker-75b6469885-74vqp 1/1 Running 0 26m
worker-75b6469885-8xmpj 1/1 Running 0 22m
worker-75b6469885-bxf5p 1/1 Running 0 22m
worker-75b6469885-htnpw 1/1 Running 0 25m
worker-75b6469885-k98xt 1/1 Running 0 83m
worker-75b6469885-nn7xp 1/1 Running 0 22m
worker-75b6469885-q4t6s 1/1 Running 0 22m
worker-75b6469885-qqxj6 1/1 Running 0 23m
worker-75b6469885-tpkx8 1/1 Running 0 27m
worker-75b6469885-zhdbr 1/1 Running 0 22m
ubuntu@ip-172-31-26-240:~$ 10
ubuntu@ip-172-31-26-240:~$ kubectl port-forward --address 0.0.0.0 prometheus-server-644d686bc6-h4pjf 6060:9090
error: unable to forward port because pod is not running. Current status=Pending
ubuntu@ip-172-31-26-240:~$ kubectl describe pod prometheus-server-644d686bc6-h4pjf
Name: prometheus-server-644d686bc6-h4pjf
Namespace: default
Priority: 0
Service Account: prometheus-server
Node: minikube/192.168.49.2
Start Time: Fri, 04 Oct 2024 09:20:00 +0000
Labels: app.kubernetes.io/component=server
app.kubernetes.io/instance=prometheus
app.kubernetes.io/managed-by=Helm
app.kubernetes.io/name=prometheus
app.kubernetes.io/part-of=prometheus
app.kubernetes.io/version=v2.54.1
helm.sh/chart=prometheus-25.27.0
pod-template-hash=644d686bc6
Annotations: <none>
Status: Pending
IP: 10.244.0.20
IPs:
IP: 10.244.0.20
Controlled By: ReplicaSet/prometheus-server-644d686bc6
Containers:
prometheus-server-configmap-reload:
Container ID: docker://cecdba13d0bfefc7c926a970ecfe2e86e73211fe7b345e02a3dd03c32e107072
Image: quay.io/prometheus-operator/prometheus-config-reloader:v0.76.0
Image ID: docker-pullable://quay.io/prometheus-operator/prometheus-config-reloader@sha256:3ee47d8f6eae9e3997bd928525946c4eb06d5bb82bf1da69ca743169c331c6a0
Port: 8080/TCP
Host Port: 0/TCP
Args:
--watched-dir=/etc/config
--listen-address=0.0.0.0:8080
--reload-url=http://127.0.0.1:9090/-/reload
State: Running
Started: Fri, 04 Oct 2024 09:20:06 +0000
Ready: True
Restart Count: 0
Liveness: http-get http://:metrics/healthz delay=2s timeout=1s period=10s #success=1 #failure=3
Readiness: http-get http://:metrics/healthz delay=0s timeout=1s period=10s #success=1 #failure=3
Environment: <none>
Mounts:
/etc/config from config-volume (ro)
/var/run/secrets/kubernetes.io/serviceaccount from kube-api-access-mh2t6 (ro)
prometheus-server:
Container ID:
Image: quay.io/prometheus/prometheus:v2.54.1
Image ID:
Port: 9090/TCP
Host Port: 0/TCP
Args:
--storage.tsdb.retention.time=15d
--config.file=/etc/config/prometheus.yml
--storage.tsdb.path=/data
--web.console.libraries=/etc/prometheus/console_libraries
--web.console.templates=/etc/prometheus/consoles
--web.enable-lifecycle
State: Waiting
Reason: ImagePullBackOff
Ready: False
Restart Count: 0
Liveness: http-get http://:9090/-/healthy delay=30s timeout=10s period=15s #success=1 #failure=3
Readiness: http-get http://:9090/-/ready delay=30s timeout=4s period=5s #success=1 #failure=3
Environment: <none>
Mounts:
/data from storage-volume (rw)
/etc/config from config-volume (rw)
/var/run/secrets/kubernetes.io/serviceaccount from kube-api-access-mh2t6 (ro)
Conditions:
Type Status
PodReadyToStartContainers True
Initialized True
Ready False
ContainersReady False
PodScheduled True
Volumes:
config-volume:
Type: ConfigMap (a volume populated by a ConfigMap)
Name: prometheus-server
Optional: false
storage-volume:
Type: PersistentVolumeClaim (a reference to a PersistentVolumeClaim in the same namespace)
ClaimName: prometheus-server
ReadOnly: false
kube-api-access-mh2t6:
Type: Projected (a volume that contains injected data from multiple sources)
TokenExpirationSeconds: 3607
ConfigMapName: kube-root-ca.crt
ConfigMapOptional: <nil>
DownwardAPI: true
QoS Class: BestEffort
Node-Selectors: <none>
Tolerations: node.kubernetes.io/not-ready:NoExecute op=Exists for 300s
node.kubernetes.io/unreachable:NoExecute op=Exists for 300s
Events:
Type Reason Age From Message
---- ------ ---- ---- -------
Normal Scheduled 15m default-scheduler Successfully assigned default/prometheus-server-644d686bc6-h4pjf to minikube
Normal Pulling 15m kubelet Pulling image "quay.io/prometheus-operator/prometheus-config-reloader:v0.76.0"
Normal Pulled 15m kubelet Successfully pulled image "quay.io/prometheus-operator/prometheus-config-reloader:v0.76.0" in 1.44s (4.558s including waiting). Image size: 42251777 bytes.
Normal Created 15m kubelet Created container prometheus-server-configmap-reload
Normal Started 15m kubelet Started container prometheus-server-configmap-reload
Warning Failed 14m (x3 over 15m) kubelet Error: ErrImagePull
Warning Failed 13m (x5 over 15m) kubelet Error: ImagePullBackOff
Normal Pulling 13m (x4 over 15m) kubelet Pulling image "quay.io/prometheus/prometheus:v2.54.1"
Warning Failed 13m (x4 over 15m) kubelet Failed to pull image "quay.io/prometheus/prometheus:v2.54.1": failed to register layer: write /bin/promtool: no space left on device
Normal BackOff 7s (x62 over 15m) kubelet Back-off pulling image "quay.io/prometheus/prometheus:v2.54.1"ChatGPT: 说是内存满了?拉取镜像失败?
ubuntu@ip-172-31-26-240:~$ kubectl get pods
NAME                                                 READY   STATUS             RESTARTS      AGE
hasher-66c759cf4b-tcswb                              1/1     Running            1 (11m ago)   91m
httplat-76994dbc8d-bkgkx                             1/1     Running            0             11m
prometheus-alertmanager-0                            1/1     Running            0             20m
prometheus-kube-state-metrics-75b5bb4bf8-7vmlt       1/1     Running            0             20m
prometheus-prometheus-node-exporter-rv9b2            1/1     Running            0             20m
prometheus-prometheus-pushgateway-84557d6c79-68jnr   1/1     Running            0             20m
prometheus-server-644d686bc6-vwtxv                   1/2     ImagePullBackOff   0             33s
redis-5657588f58-hr4gh                               1/1     Running            0             91m
rng-846cc46f5b-t99fj                                 1/1     Running            0             91m
webui-78cf59b54c-pctfb                               1/1     Running            0             91m
worker-75b6469885-bxf5p                              1/1     Running            0             30m
worker-75b6469885-k98xt                              1/1     Running            0             91m
worker-75b6469885-nn7xp                              1/1     Running            0             30m
worker-75b6469885-q4t6s                              1/1     Running            0             30m
worker-75b6469885-tpkx8                              1/1     Running            0             35m
ubuntu@ip-172-31-26-240:~$ 从您的输出可以看到,prometheus-server-644d686bc6-vwtxv 的状态仍然是 ImagePullBackOff,这意味着 Prometheus Server 的镜像拉取仍然存在问题,可能仍然是因为之前的磁盘空间不足问题。
Filesystem      Size  Used Avail Use% Mounted on
/dev/root       6.8G  6.6G  158M  98% /
tmpfs           3.9G     0  3.9G   0% /dev/shm
tmpfs           1.6G 1020K  1.6G   1% /run
tmpfs           5.0M     0  5.0M   0% /run/lock
/dev/xvda16     881M   76M  744M  10% /boot
/dev/xvda15     105M  6.1M   99M   6% /boot/efi
tmpfs           794M   12K  794M   1% /run/user/1000
10.2
重新建了一个16G内存的实例,重复了之前的步骤:
ubuntu@ip-172-31-26-254:~$ minikube addons enable metrics-server
💡  metrics-server is an addon maintained by Kubernetes. For any concerns contact minikube on GitHub.
You can view the list of minikube maintainers at: https://github.com/kubernetes/minikube/blob/master/OWNERS
    ▪ Using image registry.k8s.io/metrics-server/metrics-server:v0.7.2
🌟  The 'metrics-server' addon is enabled
ubuntu@ip-172-31-26-254:~$ df -h
Filesystem      Size  Used Avail Use% Mounted on
/dev/root        15G  6.8G  7.8G  47% /
tmpfs           3.9G     0  3.9G   0% /dev/shm
tmpfs           1.6G 1020K  1.6G   1% /run
tmpfs           5.0M     0  5.0M   0% /run/lock
/dev/xvda16     881M   76M  744M  10% /boot
/dev/xvda15     105M  6.1M   99M   6% /boot/efi
tmpfs           794M   12K  794M   1% /run/user/1000
ubuntu@ip-172-31-26-254:~$ kubectl get pods
NAME                                                 READY   STATUS    RESTARTS   AGE
hasher-66c759cf4b-hzg99                              1/1     Running   0          10m
prometheus-alertmanager-0                            1/1     Running   0          2m32s
prometheus-kube-state-metrics-75b5bb4bf8-c77kq       1/1     Running   0          2m33s
prometheus-prometheus-node-exporter-nwl64            1/1     Running   0          2m33s
prometheus-prometheus-pushgateway-84557d6c79-8g4xf   1/1     Running   0          2m33s
prometheus-server-644d686bc6-qt6ts                   2/2     Running   0          2m33s
redis-5657588f58-vmh59                               1/1     Running   0          10m
rng-846cc46f5b-wcrx6                                 1/1     Running   0          10m
webui-78cf59b54c-vvbvq                               1/1     Running   0          10m
worker-75b6469885-lpgj5                              1/1     Running   0          10m
ubuntu@ip-172-31-26-254:~$ kubectl annotate service httplat \
          prometheus.io/scrape=true \
          prometheus.io/port=9080 \
          prometheus.io/path=/metrics
Error from server (NotFound): services "httplat" not found
ubuntu@ip-172-31-26-254:~$ kubectl apply -f httplat.yaml
deployment.apps/httplat created
ubuntu@ip-172-31-26-254:~$ kubectl expose deployment httplat --port=9080
service/httplat exposed
ubuntu@ip-172-31-26-254:~$ kubectl get deploy httplat
NAME      READY   UP-TO-DATE   AVAILABLE   AGE
httplat   1/1     1            1           14s
ubuntu@ip-172-31-26-254:~$ kubectl annotate service httplat \
          prometheus.io/scrape=true \
          prometheus.io/port=9080 \
          prometheus.io/path=/metrics
service/httplat annotated
ubuntu@ip-172-31-26-254:~$ kubectl get svc prometheus-server-np
NAME                   TYPE       CLUSTER-IP       EXTERNAL-IP   PORT(S)        AGE
prometheus-server-np   NodePort   10.100.216.109   <none>        80:30807/TCP   8m8s
ubuntu@ip-172-31-26-254:~$ kubectl port-forward --address 0.0.0.0 prometheus-server-np 6060:9090
Error from server (NotFound): pods "prometheus-server-np" not found
ubuntu@ip-172-31-26-254:~$ kubectl get svc prometheus-server-np
NAME                   TYPE       CLUSTER-IP       EXTERNAL-IP   PORT(S)        AGE
prometheus-server-np   NodePort   10.100.216.109   <none>        80:30807/TCP   9m28s
ubuntu@ip-172-31-26-254:~$ kubectl get pods
NAME                                                 READY   STATUS    RESTARTS   AGE
hasher-66c759cf4b-hzg99                              1/1     Running   0          18m
httplat-6679d9985b-jchzb                             1/1     Running   0          2m27s
prometheus-alertmanager-0                            1/1     Running   0          10m
prometheus-kube-state-metrics-75b5bb4bf8-c77kq       1/1     Running   0          10m
prometheus-prometheus-node-exporter-nwl64            1/1     Running   0          10m
prometheus-prometheus-pushgateway-84557d6c79-8g4xf   1/1     Running   0          10m
prometheus-server-644d686bc6-qt6ts                   2/2     Running   0          10m
redis-5657588f58-vmh59                               1/1     Running   0          18m
rng-846cc46f5b-wcrx6                                 1/1     Running   0          18m
webui-78cf59b54c-vvbvq                               1/1     Running   0          18m
worker-75b6469885-lpgj5                              1/1     Running   0          18m
ubuntu@ip-172-31-26-254:~$ kubectl port-forward --address 0.0.0.0 prometheus-server-644d686bc6-qt6ts 6060:9090
Forwarding from 0.0.0.0:6060 -> 9090
Handling connection for 6060
Handling connection for 6060
Handling connection for 6060
Handling connection for 6060
Handling connection for 6060
ubuntu@ip-172-31-26-254:~$ $ kubectapply -f httplat.yaml
deployment.apps/httplat configured
ubuntu@ip-172-31-26-254:~$ kubectl expose deployment httplat --port=9080
Error from server (AlreadyExists): services "httplat" already exists
ubuntu@ip-172-31-26-254:~$ kubectl get deploy httplat
NAME      READY   UP-TO-DATE   AVAILABLE   AGE
httplat   1/1     1            1           35m
ubuntu@ip-172-31-26-254:~$ kubectl port-forward --address 0.0.0.0 prometheus-server-644d686bc6-qt6ts 6060:9090
Forwarding from 0.0.0.0:6060 -> 9090
Handling connection for 6060
Handling connection for 6060
Handling connection for 6060
Handling connection for 6060
Handling connection for 6060
Handling connection for 6060
11
ubuntu@ip-172-31-26-254:~$ kubectl create -f loadtest-job.yaml
job.batch/loadtestxjxj5 created
ubuntu@ip-172-31-26-254:~$
kubectl get jobs
NAME            STATUS     COMPLETIONS   DURATION   AGE
loadtestxjxj5   Complete   1/1           12s        13s
ubuntu@ip-172-31-26-254:~$ kubectl describe  job loadtestxjxj5
Name:             loadtestxjxj5
Namespace:        default
Selector:         batch.kubernetes.io/controller-uid=1bfdcec5-f4ae-42bb-8c0b-34fbd7edd70d
Labels:           batch.kubernetes.io/controller-uid=1bfdcec5-f4ae-42bb-8c0b-34fbd7edd70d
                  batch.kubernetes.io/job-name=loadtestxjxj5
                  controller-uid=1bfdcec5-f4ae-42bb-8c0b-34fbd7edd70d
                  job-name=loadtestxjxj5
Annotations:      <none>
Parallelism:      1
Completions:      1
Completion Mode:  NonIndexed
Suspend:          false
Backoff Limit:    4
Start Time:       Fri, 04 Oct 2024 11:04:51 +0000
Completed At:     Fri, 04 Oct 2024 11:05:03 +0000
Duration:         12s
Pods Statuses:    0 Active (0 Ready) / 1 Succeeded / 0 Failed
Pod Template:
  Labels:  batch.kubernetes.io/controller-uid=1bfdcec5-f4ae-42bb-8c0b-34fbd7edd70d
           batch.kubernetes.io/job-name=loadtestxjxj5
           controller-uid=1bfdcec5-f4ae-42bb-8c0b-34fbd7edd70d
           job-name=loadtestxjxj5
  Containers:
   siege:
    Image:      schoolofdevops/loadtest:v1
    Port:       <none>
    Host Port:  <none>
    Command:
      siege
      --concurrent=15
      --benchmark
      --time=4m
      http://<FILL IN>
    Environment:   <none>
    Mounts:        <none>
  Volumes:         <none>
  Node-Selectors:  <none>
  Tolerations:     <none>
Events:
  Type    Reason            Age   From            Message
  ----    ------            ----  ----            -------
  Normal  SuccessfulCreate  35s   job-controller  Created pod: loadtestxjxj5-ljnd7
  Normal  Completed         23s   job-controller  Job completed
ubuntu@ip-172-31-26-254:~$ kubectl logs  -f loadtestxjxj5
error: error from server (NotFound): pods "loadtestxjxj5" not found in namespace "default"
ubuntu@ip-172-31-26-254:~$ kubectl logs  -f loadtestxjxj5-ljnd7
** SIEGE 3.0.8
** Preparing 15 concurrent users for battle.
The server is now under siege..      done.
siege aborted due to excessive socket failure; you
can change the failure threshold in $HOME/.siegerc

Transactions:                      0 hits
Availability:                   0.00 %
Elapsed time:                   1.15 secs
Data transferred:               0.00 MB
Response time:                  0.00 secs
Transaction rate:               0.00 trans/sec
Throughput:                     0.00 MB/sec
Concurrency:                    0.00
Successful transactions:           0
Failed transactions:            1038
Longest transaction:            0.00
Shortest transaction:           0.00

FILE: /var/log/siege.log
You can disable this annoying message by editing
the .siegerc file in your home directory; change
the directive 'show-logfile' to false.
原文地址:https://blog.csdn.net/m0_74331272/article/details/142703858
免责声明:本站文章内容转载自网络资源,如本站内容侵犯了原著者的合法权益,可联系本站删除。更多内容请关注自学内容网(zxcms.com)!