Python项目:数据可视化_下载数据【笔记】
源自《Python编程:从入门到实践》
作者: Eric Matthes
02 下载数据
2.1 sitka_weather_07-2021_simple.csv
from pathlib import Path
import matplotlib.pyplot as plt
import csv
from datetime import datetime

path = Path('D:\CH16\sitka_weather_07-2021_simple.csv')
lines = path.read_text().splitlines()

reader = csv.reader(lines)
header_row = next(reader)
print(header_row)

#提取最高温度
#提取日期

highs = []
dates = []

for row in reader:
    high = int(row[4])
    highs.append(high)
    current_date = datetime.strptime(row[2], '%Y-%m-%d')
    dates.append(current_date)
print(highs)
print(dates)

#绘制温度图
plt.style.use('seaborn-v0_8')
fig, ax = plt.subplots()
ax.plot(dates, highs, color='red')

ax.set_title('Daily High Temperatures,July 2021', fontsize=24)
ax.set_xlabel('Date', fontsize=14)
ax.set_ylabel('Temperature(F)', fontsize=14)

plt.show()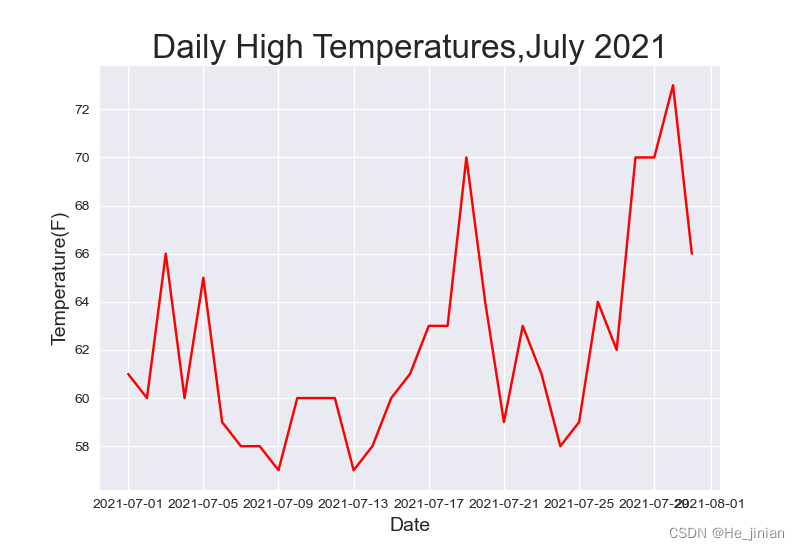
2.2 sitka_weather_2021_simple.csv
from pathlib import Path
import matplotlib.pyplot as plt
import csv
from datetime import datetime

path = Path('D:\CH16\sitka_weather_2021_simple.csv')
lines = path.read_text().splitlines()

reader = csv.reader(lines)
header_row = next(reader)
print(header_row)

#提取最高温度
#提取日期

highs = []
dates = []

for row in reader:
    high = int(row[4])
    highs.append(high)
    current_date = datetime.strptime(row[2], '%Y-%m-%d')
    dates.append(current_date)
print(highs)
print(dates)

#绘制温度图
plt.style.use('seaborn-v0_8')
fig, ax = plt.subplots()
ax.plot(dates, highs, color='red')

ax.set_title('Daily High Temperatures,2021', fontsize=24)
ax.set_xlabel('', fontsize=14)
ax.set_ylabel('Temperature(F)', fontsize=14)

plt.show()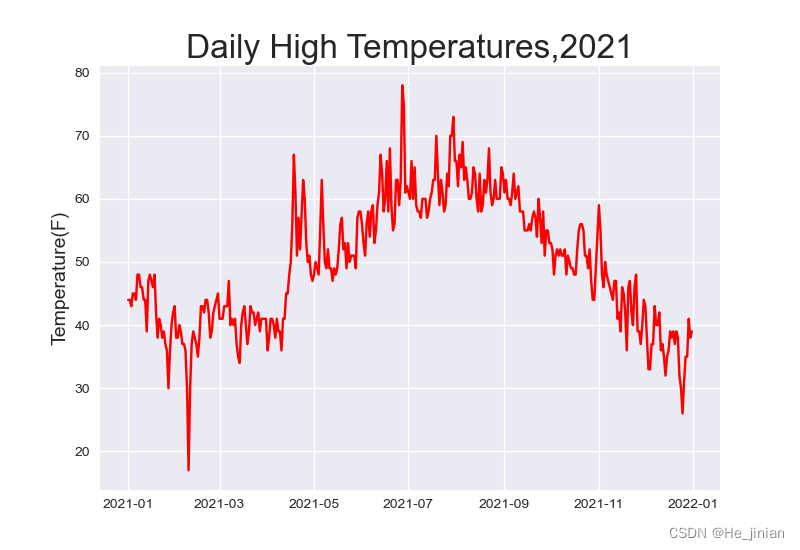
原文地址:https://blog.csdn.net/He_jinian/article/details/139091061
免责声明:本站文章内容转载自网络资源,如本站内容侵犯了原著者的合法权益,可联系本站删除。更多内容请关注自学内容网(zxcms.com)!