自学内容网 自学内容网

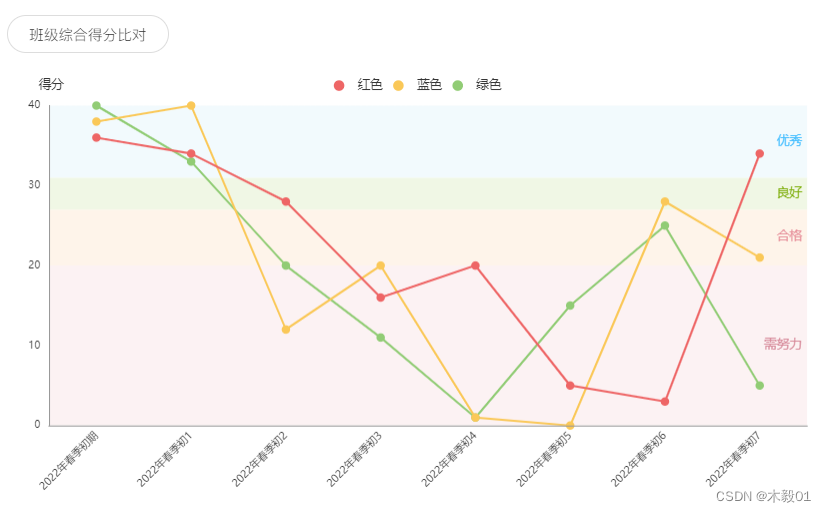
vue echarts折线图加背景颜色 值区域对应的右侧加上文本
    mounted() {
      this.lineEcharts();
    },
    lineEcharts() {
      const option = {        
        tooltip: {
          trigger: 'axis',
          transitionDuration: 0 // 让toolltip紧跟鼠标,防止抖动
        },
        title: {
          text: '得分',
          left: '25',
          textStyle:{
            color: '#333',
            fontSize: 12,
            fontWeight: 400
          },   
        },
        legend: {
          data: ['红色', '蓝色', '绿色'],
          icon: 'circle',  // 设置图例为圆点
          itemHeight: 10,
        },
        grid: {
          top: '30',
          left: '40',
          right: '20',
          bottom: '65'
        },
        xAxis: {
          name: '',
          // type: "",
          position: 'bottom',
          offset: 0,
          axisLabel: {
            rotate: 45,
            color: '#333',
            fontSize: 10
          },
          data: ['2022年春季初期', '2022年春季初1', '2022年春季初2', '2022年春季初3', '2022年春季初4', '2022年春季初5', '2022年春季初6', '2022年春季初7'],
          splitLine: {
            show: false,
          },
          zlevel: 9,
          axisTick: {
            show: false,
            inside: false
          },
          axisLine: {
            show: true,
            lineStyle: {
              color: '#999',
              width: 1, //这里是为了突出显示加上的  
            },
          }
        },
        yAxis: [
          {
            name: '',
            type: 'value',
            show: true,
            axisLabel: {
              boundaryGap: false,
              color: '#333',
              fontSize: 10,
              interval: 0
            },
            splitLine: {
              show: false,              
            },
            zlevel: 9,
            axisTick: {
              show: false
            },
            axisLine: {
              show: true,
              lineStyle: {
                color: '#999',
                width: 1, //这里是为了突出显示加上的  
              },
            }
          }
        ],        
        series: [
          {
            name: '',
            type: 'line',
            symbol: 'circle', //将小圆点改成实心 不写symbol默认空心
            symbolSize: 8, //小圆点的大小   
            silent: true,//取消交互         
            markArea: {
              data: [
                [
                  {
                    yAxis: '0', //开始
                    itemStyle: {
                      //  看这里,加了这个属性
                      color: '#fcf2f3',
                    },                    
                  },
                  {
                    yAxis: '20',
                    label: {
                      show: true,
                      position: 'insideRight',
                      color: '#d68999',
                      // 自定义显示内容(实际只显示最后一个点)
                      formatter: '需努力',
                    }  
                  }
                ],
                [
                  {
                    yAxis: '20', //结束
                    itemStyle: {
                      //  看这里,加了这个属性
                      color: '#fef4ea',
                    }
                  },
                  {
                    yAxis: '27',
                    label: {
                      show: true,
                      position: 'insideRight',
                      color: '#e6909b',
                      // 自定义显示内容(实际只显示最后一个点)
                      formatter: '合格',
                    }  
                  }
                ],
                [
                  {
                    yAxis: '27', //结束
                    itemStyle: {
                      //  看这里,加了这个属性
                      color: '#f0f7e5',
                    }
                  },
                  {
                    yAxis: '31',
                    label: {
                      show: true,
                      position: 'insideRight',
                      color: '#7eae0c',
                      // 自定义显示内容(实际只显示最后一个点)
                      formatter: '良好',
                    }  
                  }
                ],
                [
                  {
                    yAxis: '31',
                    itemStyle: {
                      //  看这里,加了这个属性
                      color: '#f2fafd',
                    }
                  },
                  {
                    yAxis: '40',
                    label: {
                      show: true,                      
                      position: 'insideRight',
                      color: '#48bfff',
                      // 自定义显示内容(实际只显示最后一个点)
                      formatter: '优秀',
                    }  
                  }
                ]
                //  如果有多种颜色,就继续在这里写区间数组,复制上面的下来改颜色
              ]
            }
          },
          {
            name: '绿色',
            data: [40, 33, 20, 11, 1, 15, 25, 5],
            type: 'line',
            symbol: 'circle', //将小圆点改成实心 不写symbol默认空心
            symbolSize: 8, //小圆点的大小            
          },
          {
            name: '蓝色',
            data: [38, 40, 12, 20, 1, 0, 28, 21],
            type: 'line',
            symbol: 'circle', //将小圆点改成实心 不写symbol默认空心
            symbolSize: 8 //小圆点的大小
          },
          {
            name: '红色',
            data: [36, 34, 28, 16, 20, 5, 3, 34],
            type: 'line',
            symbol: 'circle', //将小圆点改成实心 不写symbol默认空心
            symbolSize: 8 //小圆点的大小
          }
        ]
      };
      
      const myChart = echarts.init(document.getElementById('echartsData'));
      myChart.setOption(option);
      //随着屏幕大小调节图表
      window.addEventListener('resize', () => {
        myChart.resize();
      });
    },

个人记录用 仅供参考


原文地址:https://blog.csdn.net/qq_27806371/article/details/135502027

免责声明:本站文章内容转载自网络资源,如本站内容侵犯了原著者的合法权益,可联系本站删除。更多内容请关注自学内容网(zxcms.com)!