基于神经网络的聚类分析
神经网络是一种非常有用的机器学习模型,具有无数的应用。今天,我们将分析一个数据集,看看我们是否可以通过应用无监督聚类技术来查找数据中的模式和隐藏分组,从而获得新的见解。
我们的目标是对复杂数据进行降维,以便我们可以创建无监督的、可解释的集群,如下所示:

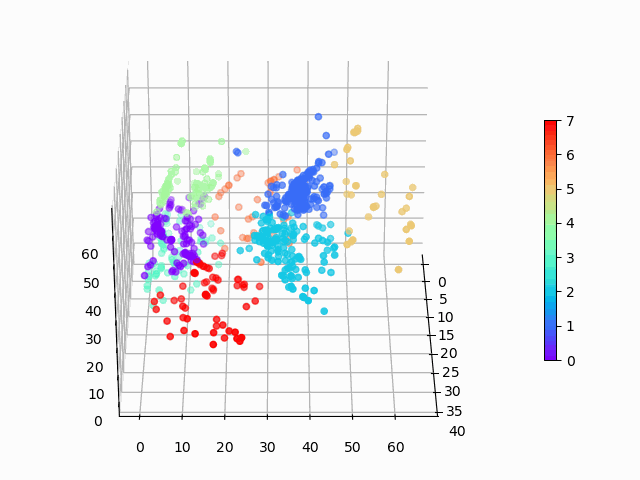
图 1:在三维空间中编码的亚马逊手机数据,使用 K 均值聚类定义了八个聚类。
NSDT工具推荐: Three.js AI纹理开发包 - YOLO合成数据生成器 - GLTF/GLB在线编辑 - 3D模型格式在线转换 - 可编程3D场景编辑器 - REVIT导出3D模型插件 - 3D模型语义搜索引擎 - Three.js虚拟轴心开发包 - 3D模型在线减面 - STL模型在线切割
1、数据
我们将研究 2019 年从亚马逊获取的手机和客户评论。该数据集由两个文件组成。
第一个文件 items.csv 包含有关单个产品的数据。它包含以下列:产品 ASIN、产品品牌、产品标题、产品 URL、产品图片 URL、产品平均评分、产品评论页面 URL、产品总评论、产品价格和产品原价。
第二个文件 reviews.csv 包含有关单个评论的数据,可以使用产品 ASIN 列将其链接到 items.csv。reviews.csv 文件的列包含:产品 ASIN、评论者姓名、评论者评分(等级 1 到 5)、评论日期、有效客户、评论标题、评论内容和有用的反馈。
为简洁起见,我们将仅关注 items.csv 文件,但你可以想象在 reviews.csv 上执行非常相似的工作流程,然后可以使用它来分析项目集群与评论者集群。
感谢 Griko Nibras 整理这些数据并将其发布在 Kaggle 上!
2、软件
今天我们将使用 Python 3.7.9 以及机器学习包 TensorFlow。我们将使用 Keras API,这使得构建神经网络变得非常简单。
稍后我们将使用函数 plot_model 来可视化神经网络。在 Windows 10 上运行该函数可能会有问题(至少在撰写本文时)。如果你愿意,可以跳过运行该函数,它会将神经网络图的图像保存到磁盘,这对于可视化很有用,但在其他方面则没有必要。
如果你遇到问题,以下是我让它工作的步骤:
- 使用 Python 3.7
- 安装 Graphviz
- 将 graphviz 添加到你的系统路径,对我来说:
C:/Program Files (x86)/Graphviz 2.44.1/bin - 安装 python 包 pydot 和 graphviz
- 将 graphviz 添加到 python 中的路径:
import os
os.environ["PATH"] += os.pathsep + 'C:/Program Files (x86)/Graphviz 2.44.1/bin' - 重新启动你的 python IDE
经过上述操作,我可以用 plot_model 了,但如果你在 Windows 上无法让它工作,我建议你改用 Linux。
3、分析
我们将整个分析流程划分为6个步骤。
3.1 加载 Python 中的库
加载以下库(并安装任何缺少的库)。
import numpy as np  # numpy for math
import pandas       # for dataframes and csv files
import matplotlib.pyplot as plt  # for plotting
from matplotlib import animation  # animate 3D plots
from mpl_toolkits.mplot3d import Axes3D  # 3D plots

# Scikit learn
from sklearn.model_selection import train_test_split
from sklearn.cluster import KMeans
from sklearn import manifold

# TensorFlow and Keras
import tensorflow as tf
from tensorflow.keras.layers.experimental import preprocessing
from tensorflow import keras
3.2 在 Python 中加载数据
请注意,我已将数据保存到相对目录“./data/”,你需要根据存储数据的位置修改路径。
items_csv = pandas.read_csv("./data/items.csv")
items_csv.head(3) # look at top 3 items
items_csv.shape   # what is the size of the data?
>>> items_csv.head(3)
asin brand ... price originalPrice
0 B0000SX2UC NaN ... 0.00 0.0
1 B0009N5L7K Motorola ... 49.95 0.0
2 B000SKTZ0S Motorola ... 99.99 0.0
[3 rows x 10 columns]
items_csv.shape
(720, 10)因此,你会看到我们有 720 行数据,每行包含 10 列信息(如预期)。在继续之前,我们将再做一步:删除所有有缺失数据的行。这是一个有争议的选择,因为我们可以使用插补来填充缺失值,或者在模型中以信息量的方式处理缺失值。为简单起见,我们将从数据集中删除所有有缺失数据的行:
items_features = items_csv.copy().dropna()
3.3 预处理数据
我们的原始数据需要进行转换才能与 Keras 很好地配合使用,因此我们需要对数据进行预处理。我们的一些列是数字,可以进行规范化,而其中一些是字符串(需要特殊处理)。我们将为模型创建一个类似于本教程的预处理层,这将使我们能够适当地使用每个特征列。
首先,我们删除不太可能有用的列:url、image、reviewUrl 和 asin:
# Let's remove these columns as not interesting for us
items_features.pop("url")
items_features.pop("image")
items_features.pop("reviewUrl")
p_labels = items_features.pop("asin")
现在我们将开始创建预处理层。我们为输入特征创建一个字典,其中包含匹配的数据类型:
inputs = {}
for name, column in items_features.items():
    dtype = column.dtype
    if dtype == object:
        dtype = tf.string
    else:
        dtype = tf.float32
    inputs[name] = tf.keras.Input(shape=(1,), name=name, dtype=dtype)

inputs
>>> inputs
{'brand': <tf.Tensor 'brand_3:0' shape=(None, 1) dtype=string>,
'title': <tf.Tensor 'title_3:0' shape=(None, 1) dtype=string>,
'rating': <tf.Tensor 'rating_3:0' shape=(None, 1) dtype=float32>,
'totalReviews': <tf.Tensor 'totalReviews_3:0' shape=(None, 1) dtype=float32>,
'price': <tf.Tensor 'price_3:0' shape=(None, 1) dtype=float32>,
'originalPrice': <tf.Tensor 'originalPrice_3:0' shape=(None, 1) dtype=float32>}你可以看到,输入包含有关数据外观的信息。我们使用它来告诉 Keras 如何将神经网络层连接在一起。
接下来,我们分离出四个数字列,将它们连接成一个特征向量,然后进行规范化:
# deal with numeric features
numeric_inputs = {name: input for name, input in inputs.items() if input.dtype == tf.float32}

x = tf.keras.layers.Concatenate()(list(numeric_inputs.values()))
norm = preprocessing.Normalization()
norm.adapt(np.array(items_features[numeric_inputs.keys()]))
all_numeric_inputs = norm(x)
preprocessed_inputs = [all_numeric_inputs]

all_numeric_inputs
>>> all_numeric_inputs
<tf.Tensor 'normalization/Identity:0' shape=(None, 4) dtype=float32>类似地,我们处理字符串特征(我们为每一列创建一个词汇表,并将它们编码为独热编码):
# deal with string features
for name, input in inputs.items():
    if input.dtype != tf.string:
        continue

    lookup = preprocessing.StringLookup(vocabulary=np.unique(items_features[name]))
    one_hot = preprocessing.CategoryEncoding(max_tokens=lookup.vocab_size())

    x = lookup(input)
    x = one_hot(x)
    preprocessed_inputs.append(x) # append preprocessed feature to features list

preprocessed_inputs
>>> preprocessed_inputs
[<tf.Tensor 'normalization/truediv:0' shape=(None, 4) dtype=float32>,
<tf.Tensor 'category_encoding_1/bincount/DenseBincount:0' shape=(None, 12) dtype=float32>,
<tf.Tensor 'category_encoding_2/bincount/DenseBincount:0' shape=(None, 716) dtype=float32>]最后,我们将预处理后的输入连接成一个向量,并创建处理模型,稍后我们可以将其应用于我们的数据,作为神经网络的第一步:
preprocessed_inputs_cat = keras.layers.Concatenate()(preprocessed_inputs)
preprocessing_layer = tf.keras.Model(inputs, preprocessed_inputs_cat, name="ProcessData")

# this saves an image of the model, see note regarding plot_model issues
tf.keras.utils.plot_model(model=preprocessing_layer, rankdir="LR", dpi=130, show_shapes=True, to_file="processing.png")
在这里您可以看到我们的处理模型的结果,从每个感兴趣的列的输入开始,到单个特征向量结束:

图 2:数据预处理层的图形可视化。
我们将该层应用到两行数据,以查看预处理层的实际作用:
items_features_dict = {name: np.array(value) for name, value in items_features.items()}

# grab two samples
two_sample_dict = {name:values[1:3, ] for name, values in items_features_dict.items()}
two_sample_dict
>>> two_sample_dict
{'brand': array(['Motorola', 'Motorola'], dtype=object),
'title': array(['MOTOROLA C168i AT&T CINGULAR PREPAID GOPHONE CELL PHONE', 'Motorola i335 Cell Phone Boost Mobile'], dtype=object),
'rating': array([2.7, 3.3]),
'totalReviews': array([22, 21], dtype=int64),
'price': array([99.99, 0. ]),
'originalPrice': array([0., 0.])}# apply the preprocessing layer
two_sample_fitted = preprocessing_layer(two_sample_dict)
two_sample_fitted>>> two_sample_fitted
<tf.Tensor: shape=(2, 732), dtype=float32, numpy=
array([[-1.4144895 , -0.50023943, -0.67571497, ..., 0. ,
0. , 0. ],
[-0.57760113, -0.50619656, -1.1760992 , ..., 0. ,
0. , 0. ]], dtype=float32)>太棒了!我们现在可以将输入数据处理成有用的张量。现在我们可以继续尝试在数据中找到自然聚类。
3.4 用于降维的自动编码器
我们的模型现在有一个预处理层,它准备原始数据以供使用。但是,一行数据(处理后)由多达 732 个特征表示。我们需要将数据的维度降低到不那么笨重的程度。为了完成这项任务,我们将使用一个简单的自编码器(autoencoder)。你可以在 keras 博客上阅读有关如何实现各种类型的自编码器的更多信息。
这是模型的自动编码器部分:
# This is the size of our input data
full_dim = two_sample_fitted.shape.as_list()[1]

# these are the downsampling/upsampling dimensions
encoding_dim1 = 128
encoding_dim2 = 16
encoding_dim3 = 3 # we will use these 3 dimensions for clustering

# This is our encoder input
encoder_input_data = keras.Input(shape=(full_dim,))

# the encoded representation of the input
encoded_layer1 = keras.layers.Dense(encoding_dim1, activation='relu')(encoder_input_data)
encoded_layer2 = keras.layers.Dense(encoding_dim2, activation='relu')(encoded_layer1)
# Note that encoded_layer3 is our 3 dimensional "clustered" layer, which we will later use for clustering
encoded_layer3 = keras.layers.Dense(encoding_dim3, activation='relu', name="ClusteringLayer")(encoded_layer2)

encoder_model = keras.Model(encoder_input_data, encoded_layer3)

# the reconstruction of the input
decoded_layer3 = keras.layers.Dense(encoding_dim2, activation='relu')(encoded_layer3)
decoded_layer2 = keras.layers.Dense(encoding_dim1, activation='relu')(decoded_layer3)
decoded_layer1 = keras.layers.Dense(full_dim, activation='sigmoid')(decoded_layer2)

# This model maps an input to its autoencoder reconstruction
autoencoder_model = keras.Model(encoder_input_data, outputs=decoded_layer1, name="Encoder")

# compile the model
autoencoder_model.compile(optimizer="RMSprop", loss=tf.keras.losses.mean_squared_error)
tf.keras.utils.plot_model(model=autoencoder_model, rankdir="LR", dpi=130, show_shapes=True, to_file="autoencoder.png")
该模型的自编码器层如下所示:

图 3:自编码器层的图形可视化。
3.5 训练模型
现在,我们需要训练模型;目前我们的模型什么都不做!所有模型权重都是随机的,并不是特别有用。
# process the inputs
p_items = preprocessing_layer(items_features_dict)

# split into training and testing sets (80/20 split)
train_data, test_data, train_labels, test_labels = train_test_split(p_items.numpy(), p_labels, train_size=0.8, random_state=5)

# fit the model using the training data
history = autoencoder_model.fit(train_data, train_data, epochs=1000, batch_size=256, shuffle=True, validation_data=(test_data, test_data))
我们来看看训练进度:
# Investigate training performance:
history_fig, (ax1, ax2) = plt.subplots(2, sharex=True)
history_fig.suptitle('Autoencoder Training Performance')
ax1.plot(range(0,1000), history.history['accuracy'], color='blue')
ax1.set(ylabel='Reconstruction Accuracy')
ax2.plot(range(0,1000), np.log10(history.history['loss']), color='blue')
ax2.plot(range(0,1000), np.log10(history.history['val_loss']), color='red', alpha=0.9)
ax2.set(ylabel='log_10(loss)', xlabel='Training Epoch')
history_fig
图 4:自动编码器模型训练历史。训练部分为蓝色,验证部分为红色。
你可以看到,我们从自动编码器获得了不错的重构效果(训练准确率 76%,验证准确率 65%)。这远非完美重构,还可以做更多工作来改进自动编码器(例如,特征特定编码、更大的编码维度等)。对于我们的目的而言,这已经足够好了。
因此,我们现在有一个编码器,它可以为我们的 732 维数据生成三维表示。它看起来是这样的:

图 5:在 3 维空间中编码的亚马逊手机数据
此时,你可能会想:“我为什么要这样做?这些是 3D 空间中的任意点,我该如何解释这种编码?”。好问题。假设你想知道产品评级如何影响其编码:

图 6:平均用户评分如何影响编码?
我希望你会同意,这出乎意料地容易解释,评分以可预测的方式从高到低分布。你可以制作类似的图表来可视化其他特征对编码的影响。
3.6 聚类
经过所有这些准备,我们终于可以尝试对数据进行聚类了。聚类的方法有很多。我们将使用 K-means 作为最简单的聚类方法之一。我们不仅对原始数据进行聚类,还使用数据的自动编码器表示,以便将问题的维数从 732 维一直降低到 3 维。
第一步,我们需要决定使用多少个聚类!我们将使用elbow方法,如这个 K-means 教程中所示:
encoded_items = encoder_model(p_items)

# choose number of clusters K:
Sum_of_squared_distances = []
K = range(1,30)
for k in K:
    km = KMeans(init='k-means++', n_clusters=k, n_init=10)
    km.fit(encoded_items)
    Sum_of_squared_distances.append(km.inertia_)

plt.plot(K, Sum_of_squared_distances, 'bx-')
plt.vlines(ymin=0, ymax=150000, x=8, colors='red')
plt.text(x=8.2, y=130000, s="optimal K=8")
plt.xlabel('Number of Clusters K')
plt.ylabel('Sum of squared distances')
plt.title('Elbow Method For Optimal K')
plt.show()
图 7:用于在 K 均值中选择最佳 K 的肘部图
从肘形图来看,K 介于 5 和 10 之间比较合适。我们以 K=8 作为最佳选择。
在这里,我们使用 8 个聚类来拟合 K 均值:
kmeans = KMeans(init='k-means++', n_clusters=8, n_init=10)
kmeans.fit(encoded_items)
P = kmeans.predict(encoded_items)
我们可以在三维表示中轻松地看到这些聚类:
# visualize the clusters:
encoded_fig = plt.figure()
ax = Axes3D(encoded_fig)
p = ax.scatter(encoded_items[:,0], encoded_items[:,1], encoded_items[:,2], c=P, marker="o", picker=True, cmap="rainbow")
plt.colorbar(p, shrink=0.5)
plt.show()

angle = 3
ani = animation.FuncAnimation(encoded_fig, rotate, frames=np.arange(0, 360, angle), interval=50)
ani.save('kmeans_fig.gif', writer=animation.PillowWriter(fps=12))
图 8:在三维空间中编码的亚马逊手机数据,使用 K 均值聚类定义了 8 个聚类。
聚类看起来基本合理,但是聚类之间显然存在一些差异,而且 K 均值无法清晰地识别出视觉上清晰的月牙形聚类。对此,可能应该使用更复杂的聚类算法。基于密度的聚类将是我的下一个选择!
4、结论
我们只是触及了该数据集可以做什么的表面,并且有许多不同的技术可以执行聚类(包括监督和无监督)。可以进行额外的工作,分析聚类本身的可解释性(例如,基于聚类的品牌、评级、价格等直方图)。我希望本指南能让你了解如何将这些想法应用于自己的数据!
原文链接:神经网络聚类分析 - BimAnt
原文地址:https://blog.csdn.net/shebao3333/article/details/140606708
免责声明:本站文章内容转载自网络资源,如本站内容侵犯了原著者的合法权益,可联系本站删除。更多内容请关注自学内容网(zxcms.com)!
