echart-折线图
示例图:
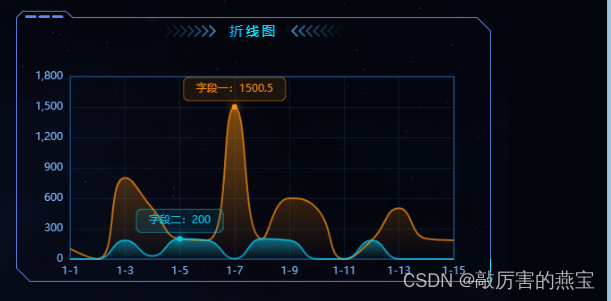
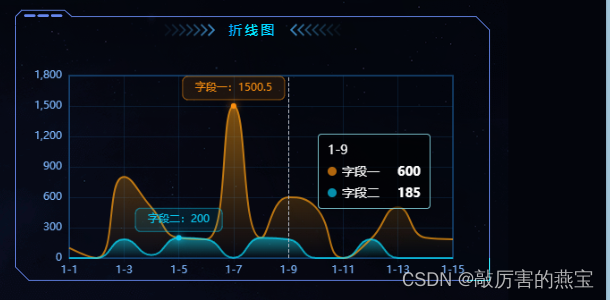
代码:
封装为组件 right-top.vue
使用props传值
由于 props 是单向数据流的,它是只能从父组件传递到子组件的,而子组件是无法更改 props 的值的,只能由父组件来修改。这样就保证了组件的数据传递不会出现混乱和错乱的情况。
关于echarts的option配置可以看下官网的配置项手册
<script setup lang="ts">
import { ref,onMounted,watch} from "vue";
import { currentGET } from "@/api";
import {graphic} from "echarts/core"

const option = ref({});
//数据
const props = defineProps({//props声明
  data: {
    type: Object, // 对象类型
    required: true, // 必须的
    default: () => ({ // 默认值为一个包含三个空数组的对象
      timeArray: [],
      billInBoundCountArray:[],
      billOutBoundCountArray:[]
    })
  }
})


onMounted(() => {
  Chart();
  console.log("要看这个 11111111",props.data)
});


const setOption =async (xData:any[], yData:any[], yData2:any[]) => {
  option.value = {
        xAxis: {
          type: "category",
          data: xData,
          boundaryGap: false, // 不留白,从原点开始
          splitLine: {
            show: true,
            lineStyle: {
              color: "rgba(31,99,163,.2)",
            },
          },
          axisLine: {
            // show:false,
            lineStyle: {
              color: "rgba(31,99,163,.1)",
            },
          },
          axisLabel: {
            color: "#7EB7FD",
            fontWeight: "500",
          },
        },
        yAxis: {
          type: "value",
          splitLine: {
            show: true,
            lineStyle: {
              color: "rgba(31,99,163,.2)",
            },
          },
          axisLine: {
            lineStyle: {
              color: "rgba(31,99,163,.1)",
            },
          },
          axisLabel: {
            color: "#7EB7FD",
            fontWeight: "500",
          },
        },
        tooltip: {
          trigger: "axis",
          backgroundColor: "rgba(0,0,0,.6)",
          borderColor: "rgba(147, 235, 248, .8)",
          textStyle: {
            color: "#FFF",
          },
        },
        grid: {
          //布局
          show: true,
          left: "10px",
          right: "30px",
          bottom: "10px",
          top: "32px",
          containLabel: true,
          borderColor: "#1F63A3",
        },
        series: [
          {
            data: yData,
            type: "line",
            smooth: true,
            symbol: "none", //去除点
            name: "字段一",
            color: "rgba(252,144,16,.7)",
            areaStyle: {
                //右,下,左,上
                color: new graphic.LinearGradient(
                  0,
                  0,
                  0,
                  1,
                  [
                    {
                      offset: 0,
                      color: "rgba(252,144,16,.7)",//向上渐变色
                    },
                    {
                      offset: 1,
                      color: "rgba(252,144,16,.0)",//下面颜色
                    },
                  ],
                  false
                ),
            },
            markPoint: {
              data: [
                {
                  name: "最大值",
                  type: "max",
                  valueDim: "y",
                  symbol: "rect",
                  symbolSize: [60, 26],
                  symbolOffset: [0, -20],
                  itemStyle: {
                    color: "rgba(0,0,0,0)",
                  },
                  label: {
                    color: "#FC9010",
                    backgroundColor: "rgba(252,144,16,0.1)",
                    borderRadius: 6,
                    padding: [7, 14],
                    borderWidth: 0.5,
                    borderColor: "rgba(252,144,16,.5)",
                    formatter: "字段一:{c}",
                  },
                },
                {
                  name: "最大值",
                  type: "max",
                  valueDim: "y",
                  symbol: "circle",
                  symbolSize: 6,
                  itemStyle: {
                    color: "#FC9010",//最大点
                    shadowColor: "#FC9010",
                    shadowBlur: 8,
                  },
                  label: {
                    formatter: "",
                  },
                },
              ],
            },
          },
          {
            data: yData2,
            type: "line",
            smooth: true,
            symbol: "none", //去除点
            name: "字段二",
            color: "rgba(9,202,243,.7)",//线的颜色
            areaStyle: {
                //右,下,左,上
                color: new graphic.LinearGradient(
                  0,
                  0,
                  0,
                  1,
                  [
                    {
                      offset: 0,
                      color: "rgba(9,202,243,.7)",//向上渐变色
                    },
                    {
                      offset: 1,
                      color: "rgba(9,202,243,.0)",
                    },
                  ],
                  false
                ),
            },
            markPoint: {
              data: [
                {
                  name: "最大值",
                  type: "max",
                  valueDim: "y",
                  symbol: "rect",
                  symbolSize: [60, 26],
                  symbolOffset: [0, -20],
                  itemStyle: {
                    color: "rgba(0,0,0,0)",
                  },
                  label: {
                    color: "#09CAF3",
                    backgroundColor: "rgba(9,202,243,0.1)",
                    borderRadius: 6,
                    borderColor: "rgba(9,202,243,.5)",
                    padding: [7, 14],
                    formatter: "字段二:{c}",
                    borderWidth: 0.5,
                  },
                },
                {
                  name: "最大值",
                  type: "max",
                  valueDim: "y",
                  symbol: "circle",
                  symbolSize: 6,
                  itemStyle: {
                    color: "#09CAF3",
                    shadowColor: "#09CAF3",
                    shadowBlur: 8,
                  },
                  label: {
                    formatter: "",
                  },
                },
              ],
            },
          },
        ],
      };
}
onMounted(()=>{

})
const chart = ref(null);
const Chart = () => {
  // 使用 getPie3D 函数生成的 option 配置
  //3、通过实例.setOptions(option)
  setOption(props.data.timeArray, props.data.billInTotalCountArray, props.data.billOutTotalCountArray);
}

//用于观察props.data属性的变化并在发生变化时调用rotatingPieChart函数。
watch(() => props.data, Chart)
</script>

<template>
  <v-chart
    class="chart"
    :option="option"
    v-if="JSON.stringify(option) != '{}'"
  />
</template>

<style scoped lang="scss"></style>
父页面调用:
<ItemWrap class="contetn_left-bottom contetn_lr-item" title="折线图">
  <RightTop :data="data.RightTopData1"  v-if="!isLoading3" />
</ItemWrap>
数据样式:
const data = {

  RightTopData1:{
    timeArray: ["1-1", "1-2", "1-3","1-4", "1-5", "1-6","1-7", "1-8", "1-9","1-10", "1-11", "1-12","1-13", "1-14", "1-15"],//日期
    billOutTotalCountArray: [0.0, 0.0, 185,30, 200, 185,2, 200, 185,0.0, 0.0, 185,0.0, 0.0, 0.0],//字段一
    billInTotalCountArray: [100.0, 0.0, 800,500, 200, 185,1500.5, 200, 600,500, 1, 185,500, 200, 185],//字段二
  },
   }
参考:
Documentation - Apache ECharts
原文地址:https://blog.csdn.net/m0_63456808/article/details/137456351
免责声明:本站文章内容转载自网络资源,如本站内容侵犯了原著者的合法权益,可联系本站删除。更多内容请关注自学内容网(zxcms.com)!