Grafana dashboards as ConfigMaps
1. 简介
将 Grafana 仪表板存储为 Kubernetes ConfigMap 相比传统的通过 Grafana 界面导入仪表板有以下一些主要优点:
- 版本控制: ConfigMap 可以存储在版本控制系统(如Git)中,便于跟踪和管理仪表板的变更历史。而传统方式下,仪表板的改动很难追踪和恢复。
- 可移植性:ConfigMap 是 Kubernetes 原生对象,可以在不同的集群和环境之间轻松迁移和共享。传统方式下,仪表板需要通过导出导入的方式在不同环境之间传递。
- 集中管理: 所有仪表板都可以作为 ConfigMap 集中存储和管理,避免分散在多个位置。传统方式下,仪表板管理较为分散。
- 动态更新:Kubernetes 支持在不重启 Grafana 的情况下更新 ConfigMap,从而无缓冲更新仪表板。传统方式需要重启 Grafana 使更改生效。
- 一致性部署: 通过 ConfigMap 的方式,可以确保 Grafana 实例在部署时使用完全一致的仪表板配置。
- 安全性 :ConfigMap 可以利用 Kubernetes 的角色访问控制机制来管理访问权限。
- 自动化: ConfigMap 可以与 GitOps 工作流相结合,实现仪表板配置的自动化部署和更新。
总的来说,使用 ConfigMap 管理 Grafana 仪表板能够提高可维护性、一致性和自动化程度,同时增强安全性和可迁移性,非常适合云原生环境下的使用。
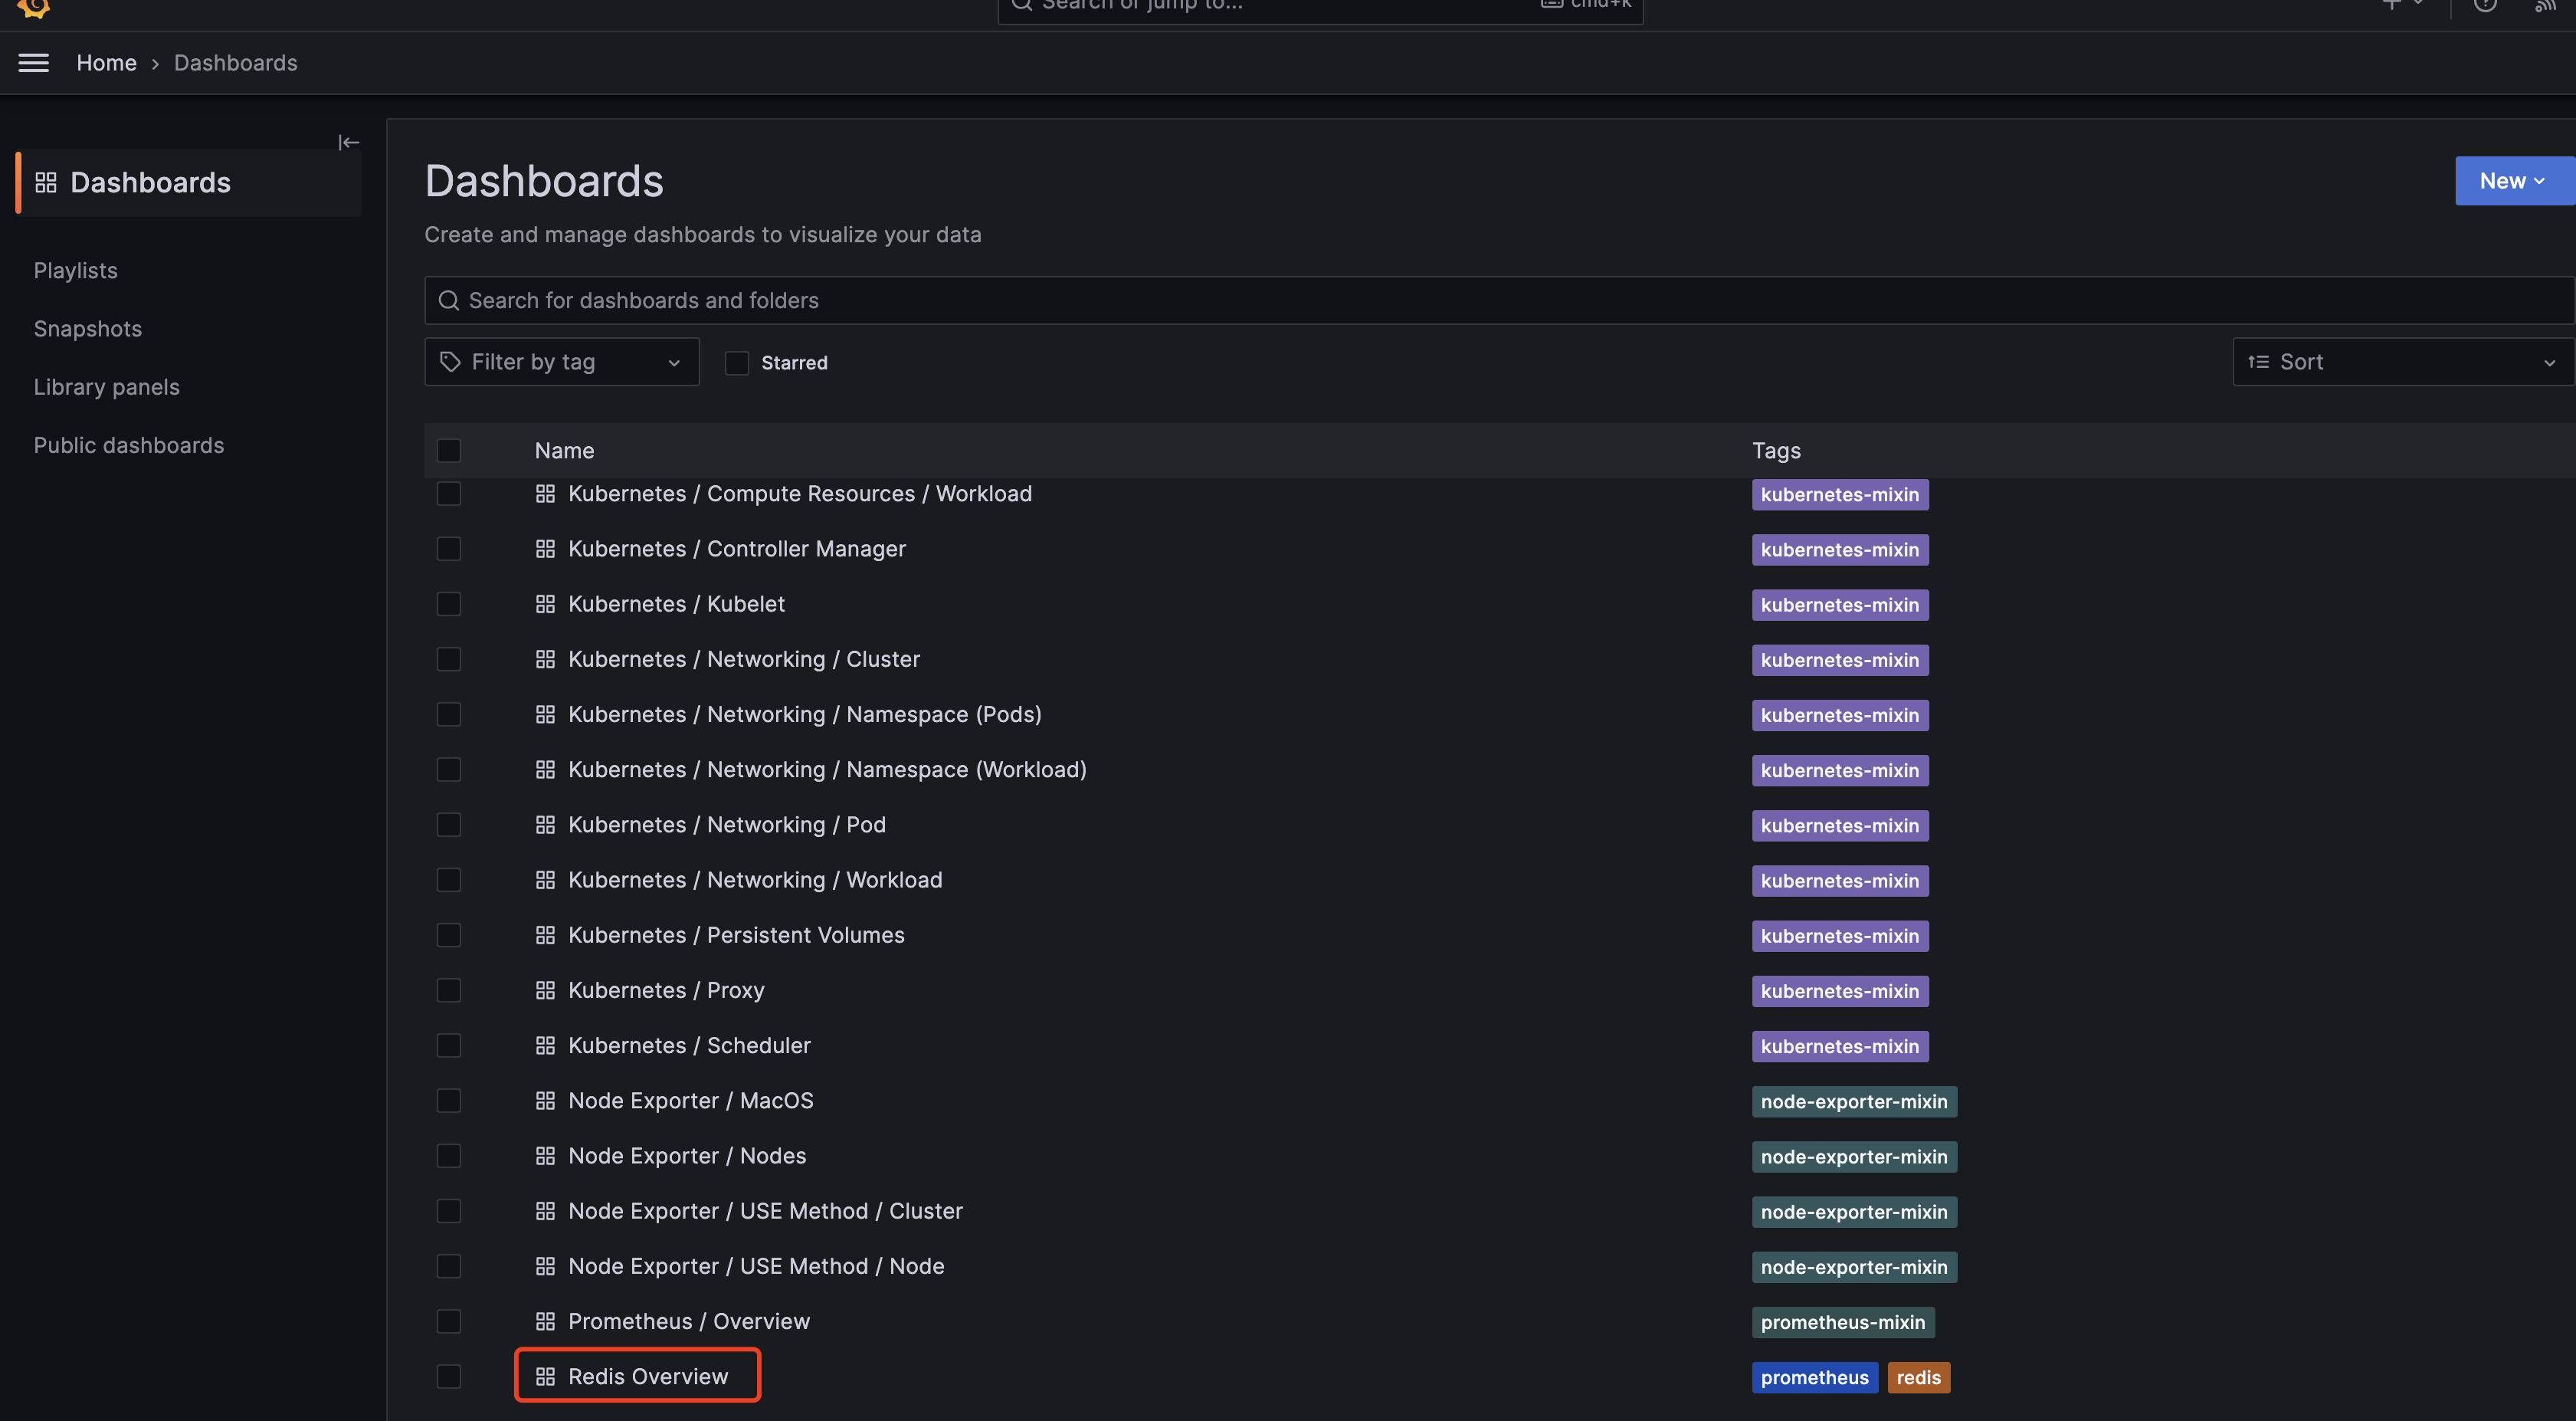
获取监控仪表盘的json文件,例如,展示 Gafana Redis Overview dashboard 的 redis.json,以prometheus作为数据源。
{
"annotations": {
"list": [
{
"builtIn": 1,
"datasource": "-- Grafana --",
"enable": true,
"hide": true,
"iconColor": "rgba(0, 211, 255, 1)",
"name": "Annotations & Alerts",
"type": "dashboard"
}
]
},
"description": "Redis Overview",
"editable": true,
"gnetId": 763,
"graphTooltip": 1,
"id": 28,
"iteration": 1620627698368,
"links": [],
"panels": [
{
"cacheTimeout": null,
"colorBackground": false,
"colorValue": false,
"colors": [
"rgba(245, 54, 54, 0.9)",
"rgba(237, 129, 40, 0.89)",
"rgba(50, 172, 45, 0.97)"
],
"datasource": "Prometheus",
"decimals": 0,
"editable": true,
"error": false,
"fieldConfig": {
"defaults": {
"custom": {}
},
"overrides": []
},
"format": "s",
"gauge": {
"maxValue": 100,
"minValue": 0,
"show": false,
"thresholdLabels": false,
"thresholdMarkers": true
},
"gridPos": {
"h": 7,
"w": 3,
"x": 0,
"y": 0
},
"id": 9,
"interval": null,
"isNew": true,
"links": [],
"mappingType": 1,
"mappingTypes": [
{
"name": "value to text",
"value": 1
},
{
"name": "range to text",
"value": 2
}
],
"maxDataPoints": 100,
"nullPointMode": "connected",
"nullText": null,
"postfix": "",
"postfixFontSize": "50%",
"prefix": "",
"prefixFontSize": "50%",
"rangeMaps": [
{
"from": "null",
"text": "N/A",
"to": "null"
}
],
"sparkline": {
"fillColor": "rgba(31, 118, 189, 0.18)",
"full": false,
"lineColor": "rgb(31, 120, 193)",
"show": true
},
"tableColumn": "",
"targets": [
{
"expr": "max(max_over_time(redis_uptime_in_seconds{service=~\"$service\",pod=~\"$pod\"}[$__interval]))",
"format": "time_series",
"interval": "",
"intervalFactor": 2,
"legendFormat": "",
"metric": "",
"refId": "A",
"step": 1800
}
],
"thresholds": "",
"title": "Max Uptime",
"type": "singlestat",
"valueFontSize": "70%",
"valueMaps": [
{
"op": "=",
"text": "N/A",
"value": "null"
}
],
"valueName": "current"
},
{
"cacheTimeout": null,
"colorBackground": false,
"colorValue": false,
"colors": [
"rgba(245, 54, 54, 0.9)",
"rgba(237, 129, 40, 0.89)",
"rgba(50, 172, 45, 0.97)"
],
"datasource": "Prometheus",
"decimals": 0,
"editable": true,
"error": false,
"fieldConfig": {
"defaults": {
"custom": {}
},
"overrides": []
},
"format": "none",
"gauge": {
"maxValue": 100,
"minValue": 0,
"show": false,
"thresholdLabels": false,
"thresholdMarkers": true
},
"gridPos": {
"h": 7,
"w": 2,
"x": 3,
"y": 0
},
"hideTimeOverride": true,
"id": 12,
"interval": null,
"isNew": true,
"links": [],
"mappingType": 1,
"mappingTypes": [
{
"name": "value to text",
"value": 1
},
{
"name": "range to text",
"value": 2
}
],
"maxDataPoints": 100,
"nullPointMode": "connected",
"nullText": null,
"postfix": "",
"postfixFontSize": "50%",
"prefix": "",
"prefixFontSize": "50%",
"rangeMaps": [
{
"from": "null",
"text": "N/A",
"to": "null"
}
],
"sparkline": {
"fillColor": "rgba(31, 118, 189, 0.18)",
"full": false,
"lineColor": "rgb(31, 120, 193)",
"show": true
},
"tableColumn": "",
"targets": [
{
"expr": "sum(redis_connected_clients{service=~\"$service\",pod=~\"$pod\"})",
"format": "time_series",
"intervalFactor": 2,
"legendFormat": "",
"metric": "",
"refId": "A",
"step": 2
}
],
"thresholds": "",
"timeFrom": "1m",
"timeShift": null,
"title": "Clients",
"type": "singlestat",
"valueFontSize": "80%",
"valueMaps": [
{
"op": "=",
"text": "N/A",
"value": "null"
}
],
"valueName": "current"
},
{
"cacheTimeout": null,
"colorBackground": false,
"colorValue": false,
"colors": [
"rgba(50, 172, 45, 0.97)",
"rgba(237, 129, 40, 0.89)",
"rgba(245, 54, 54, 0.9)"
],
"datasource": "Prometheus",
"decimals": 0,
"editable": true,
"error": false,
"fieldConfig": {
"defaults": {
"custom": {}
},
"overrides": []
},
"format": "percent",
"gauge": {
"maxValue": 100,
"minValue": 0,
"show": true,
"thresholdLabels": false,
"thresholdMarkers": true
},
"gridPos": {
"h": 7,
"w": 3,
"x": 5,
"y": 0
},
"hideTimeOverride": true,
"id": 11,
"interval": null,
"isNew": true,
"links": [],
"mappingType": 1,
"mappingTypes": [
{
"name": "value to text",
"value": 1
},
{
"name": "range to text",
"value": 2
}
],
"maxDataPoints": 100,
"nullPointMode": "connected",
"nullText": null,
"postfix": "",
"postfixFontSize": "50%",
"prefix": "",
"prefixFontSize": "50%",
"rangeMaps": [
{
"from": "null",
"text": "N/A",
"to": "null"
}
],
"sparkline": {
"fillColor": "rgba(31, 118, 189, 0.18)",
"full": false,
"lineColor": "rgb(31, 120, 193)",
"show": true
},
"tableColumn": "",
"targets": [
{
"expr": "sum(100 * (redis_memory_used_bytes{service=~\"$service\",pod=~\"$pod\"} / redis_memory_max_bytes{service=~\"$service\",pod=~\"$pod\"}))",
"format": "time_series",
"interval": "",
"intervalFactor": 2,
"legendFormat": "",
"metric": "",
"refId": "A",
"step": 2
}
],
"thresholds": "80,95",
"timeFrom": "1m",
"timeShift": null,
"title": "Memory Usage",
"type": "singlestat",
"valueFontSize": "80%",
"valueMaps": [
{
"op": "=",
"text": "N/A",
"value": "null"
}
],
"valueName": "current"
},
{
"aliasColors": {},
"bars": false,
"dashLength": 10,
"dashes": false,
"datasource": "Prometheus",
"editable": true,
"error": false,
"fieldConfig": {
"defaults": {
"custom": {},
"links": []
},
"overrides": []
},
"fill": 8,
"fillGradient": 0,
"grid": {},
"gridPos": {
"h": 7,
"w": 8,
"x": 8,
"y": 0
},
"hiddenSeries": false,
"id": 18,
"isNew": true,
"legend": {
"avg": false,
"current": false,
"hideEmpty": false,
"hideZero": false,
"max": false,
"min": false,
"show": true,
"total": false,
"values": false
},
"lines": true,
"linewidth": 1,
"links": [],
"nullPointMode": "connected",
"options": {
"alertThreshold": true
},
"percentage": false,
"pluginVersion": "7.4.2",
"pointradius": 5,
"points": false,
"renderer": "flot",
"seriesOverrides": [],
"spaceLength": 10,
"stack": true,
"steppedLine": false,
"targets": [
{
"expr": "sum(rate(redis_commands_total{service=~\"$service\",pod=~\"$pod\"} [1m])) by (cmd)",
"format": "time_series",
"interval": "",
"intervalFactor": 2,
"legendFormat": "{{ cmd }}",
"metric": "redis_command_calls_total",
"refId": "A",
"step": 240
}
],
"thresholds": [],
"timeFrom": null,
"timeRegions": [],
"timeShift": null,
"title": "Total Commands / sec",
"tooltip": {
"msResolution": true,
"shared": true,
"sort": 2,
"value_type": "individual"
},
"type": "graph",
"xaxis": {
"buckets": null,
"mode": "time",
"name": null,
"show": true,
"values": []
},
"yaxes": [
{
"format": "short",
"label": null,
"logBase": 1,
"max": null,
"min": null,
"show": true
},
{
"format": "short",
"label": null,
"logBase": 1,
"max": null,
"min": null,
"show": true
}
],
"yaxis": {
"align": false,
"alignLevel": null
}
},
{
"aliasColors": {},
"bars": false,
"dashLength": 10,
"dashes": false,
"datasource": "Prometheus",
"decimals": 2,
"editable": true,
"error": false,
"fieldConfig": {
"defaults": {
"custom": {},
"links": []
},
"overrides": []
},
"fill": 1,
"fillGradient": 0,
"grid": {},
"gridPos": {
"h": 7,
"w": 8,
"x": 16,
"y": 0
},
"hiddenSeries": false,
"id": 1,
"isNew": true,
"legend": {
"avg": false,
"current": false,
"max": false,
"min": false,
"show": true,
"total": false,
"values": false
},
"lines": true,
"linewidth": 2,
"links": [],
"nullPointMode": "connected",
"options": {
"alertThreshold": true
},
"percentage": true,
"pluginVersion": "7.4.2",
"pointradius": 5,
"points": false,
"renderer": "flot",
"seriesOverrides": [],
"spaceLength": 10,
"stack": false,
"steppedLine": false,
"targets": [
{
"expr": "irate(redis_keyspace_hits_total{service=~\"$service\",pod=~\"$pod\"}[5m])",
"format": "time_series",
"hide": false,
"interval": "",
"intervalFactor": 2,
"legendFormat": "hits, {{ pod }}",
"metric": "",
"refId": "A",
"step": 240,
"target": ""
},
{
"expr": "irate(redis_keyspace_misses_total{service=~\"$service\",pod=~\"$pod\"}[5m])",
"format": "time_series",
"hide": false,
"interval": "",
"intervalFactor": 2,
"legendFormat": "misses, {{ pod }}",
"metric": "",
"refId": "B",
"step": 240,
"target": ""
}
],
"thresholds": [],
"timeFrom": null,
"timeRegions": [],
"timeShift": null,
"title": "Hits / Misses per Sec",
"tooltip": {
"msResolution": false,
"shared": true,
"sort": 0,
"value_type": "individual"
},
"type": "graph",
"xaxis": {
"buckets": null,
"mode": "time",
"name": null,
"show": true,
"values": []
},
"yaxes": [
{
"format": "short",
"label": "",
"logBase": 1,
"max": null,
"min": 0,
"show": true
},
{
"format": "short",
"label": null,
"logBase": 1,
"max": null,
"min": null,
"show": true
}
],
"yaxis": {
"align": false,
"alignLevel": null
}
},
{
"aliasColors": {
"max": "#BF1B00"
},
"bars": false,
"dashLength": 10,
"dashes": false,
"datasource": "Prometheus",
"editable": true,
"error": false,
"fieldConfig": {
"defaults": {
"custom": {},
"links": []
},
"overrides": []
},
"fill": 1,
"fillGradient": 0,
"grid": {},
"gridPos": {
"h": 7,
"w": 12,
"x": 0,
"y": 7
},
"hiddenSeries": false,
"id": 7,
"isNew": true,
"legend": {
"avg": false,
"current": false,
"hideEmpty": false,
"hideZero": false,
"max": false,
"min": false,
"show": true,
"total": false,
"values": false
},
"lines": true,
"linewidth": 2,
"links": [],
"nullPointMode": "null as zero",
"options": {
"alertThreshold": true
},
"percentage": false,
"pluginVersion": "7.4.2",
"pointradius": 5,
"points": false,
"renderer": "flot",
"seriesOverrides": [],
"spaceLength": 10,
"stack": false,
"steppedLine": false,
"targets": [
{
"expr": "redis_memory_used_bytes{service=~\"$service\",pod=~\"$pod\"}",
"format": "time_series",
"interval": "",
"intervalFactor": 2,
"legendFormat": "used, {{ pod }}",
"metric": "",
"refId": "A",
"step": 240,
"target": ""
},
{
"expr": "redis_memory_max_bytes{service=~\"$service\",pod=~\"$pod\"}",
"format": "time_series",
"hide": false,
"interval": "",
"intervalFactor": 2,
"legendFormat": "max, {{ pod }}",
"refId": "B",
"step": 240
}
],
"thresholds": [],
"timeFrom": null,
"timeRegions": [],
"timeShift": null,
"title": "Total Memory Usage",
"tooltip": {
"msResolution": false,
"shared": true,
"sort": 0,
"value_type": "cumulative"
},
"type": "graph",
"xaxis": {
"buckets": null,
"mode": "time",
"name": null,
"show": true,
"values": []
},
"yaxes": [
{
"format": "bytes",
"label": null,
"logBase": 1,
"max": null,
"min": 0,
"show": true
},
{
"format": "short",
"label": null,
"logBase": 1,
"max": null,
"min": null,
"show": true
}
],
"yaxis": {
"align": false,
"alignLevel": null
}
},
{
"aliasColors": {},
"bars": false,
"dashLength": 10,
"dashes": false,
"datasource": "Prometheus",
"editable": true,
"error": false,
"fieldConfig": {
"defaults": {
"custom": {},
"links": []
},
"overrides": []
},
"fill": 1,
"fillGradient": 0,
"grid": {},
"gridPos": {
"h": 7,
"w": 12,
"x": 12,
"y": 7
},
"hiddenSeries": false,
"id": 10,
"isNew": true,
"legend": {
"avg": false,
"current": false,
"max": false,
"min": false,
"show": true,
"total": false,
"values": false
},
"lines": true,
"linewidth": 2,
"links": [],
"nullPointMode": "connected",
"options": {
"alertThreshold": true
},
"percentage": false,
"pluginVersion": "7.4.2",
"pointradius": 5,
"points": false,
"renderer": "flot",
"seriesOverrides": [],
"spaceLength": 10,
"stack": false,
"steppedLine": false,
"targets": [
{
"expr": "sum(rate(redis_net_input_bytes_total{service=~\"$service\",pod=~\"$pod\"}[5m])) by (pod)",
"format": "time_series",
"interval": "",
"intervalFactor": 2,
"legendFormat": "input, {{ pod }}",
"refId": "A",
"step": 240
},
{
"expr": "sum(rate(redis_net_output_bytes_total{service=~\"$service\",pod=~\"$pod\"}[5m])) by (pod)",
"format": "time_series",
"interval": "",
"intervalFactor": 2,
"legendFormat": "output, {{ pod }}",
"refId": "B",
"step": 240
}
],
"thresholds": [],
"timeFrom": null,
"timeRegions": [],
"timeShift": null,
"title": "Network I/O",
"tooltip": {
"msResolution": true,
"shared": true,
"sort": 0,
"value_type": "cumulative"
},
"type": "graph",
"xaxis": {
"buckets": null,
"mode": "time",
"name": null,
"show": true,
"values": []
},
"yaxes": [
{
"format": "bytes",
"label": null,
"logBase": 1,
"max": null,
"min": null,
"show": true
},
{
"format": "short",
"label": null,
"logBase": 1,
"max": null,
"min": null,
"show": true
}
],
"yaxis": {
"align": false,
"alignLevel": null
}
},
{
"aliasColors": {},
"bars": false,
"dashLength": 10,
"dashes": false,
"datasource": "Prometheus",
"editable": true,
"error": false,
"fieldConfig": {
"defaults": {
"custom": {},
"links": []
},
"overrides": []
},
"fill": 7,
"fillGradient": 0,
"grid": {},
"gridPos": {
"h": 7,
"w": 12,
"x": 0,
"y": 14
},
"hiddenSeries": false,
"id": 5,
"isNew": true,
"legend": {
"alignAsTable": false,
"avg": false,
"current": true,
"hideEmpty": false,
"hideZero": true,
"max": false,
"min": false,
"rightSide": false,
"show": true,
"total": false,
"values": true
},
"lines": true,
"linewidth": 2,
"links": [],
"nullPointMode": "connected",
"options": {
"alertThreshold": true
},
"percentage": false,
"pluginVersion": "7.4.2",
"pointradius": 5,
"points": false,
"renderer": "flot",
"seriesOverrides": [],
"spaceLength": 10,
"stack": true,
"steppedLine": false,
"targets": [
{
"expr": "sum (redis_db_keys{service=~\"$service\",pod=~\"$pod\"}) by (db, pod)",
"format": "time_series",
"interval": "",
"intervalFactor": 2,
"legendFormat": "{{ db }}, {{ pod }}",
"refId": "A",
"step": 240,
"target": ""
}
],
"thresholds": [],
"timeFrom": null,
"timeRegions": [],
"timeShift": null,
"title": "Total Items per DB",
"tooltip": {
"msResolution": false,
"shared": true,
"sort": 0,
"value_type": "individual"
},
"type": "graph",
"xaxis": {
"buckets": null,
"mode": "time",
"name": null,
"show": true,
"values": []
},
"yaxes": [
{
"format": "none",
"label": null,
"logBase": 1,
"max": null,
"min": null,
"show": true
},
{
"format": "short",
"label": null,
"logBase": 1,
"max": null,
"min": null,
"show": true
}
],
"yaxis": {
"align": false,
"alignLevel": null
}
},
{
"aliasColors": {},
"bars": false,
"dashLength": 10,
"dashes": false,
"datasource": "Prometheus",
"editable": true,
"error": false,
"fieldConfig": {
"defaults": {
"custom": {},
"links": []
},
"overrides": []
},
"fill": 7,
"fillGradient": 0,
"grid": {},
"gridPos": {
"h": 7,
"w": 12,
"x": 12,
"y": 14
},
"hiddenSeries": false,
"id": 13,
"isNew": true,
"legend": {
"avg": false,
"current": false,
"max": false,
"min": false,
"show": true,
"total": false,
"values": false
},
"lines": true,
"linewidth": 2,
"links": [],
"nullPointMode": "connected",
"options": {
"alertThreshold": true
},
"percentage": false,
"pluginVersion": "7.4.2",
"pointradius": 5,
"points": false,
"renderer": "flot",
"seriesOverrides": [],
"spaceLength": 10,
"stack": true,
"steppedLine": false,
"targets": [
{
"expr": "sum (redis_db_keys{service=~\"$service\",pod=~\"$pod\"}) by (pod) - sum (redis_db_keys_expiring{service=~\"$service\",pod=~\"$pod\"}) by (pod)",
"format": "time_series",
"interval": "",
"intervalFactor": 2,
"legendFormat": "not expiring, {{ pod }}",
"refId": "A",
"step": 240,
"target": ""
},
{
"expr": "sum (redis_db_keys_expiring{service=~\"$service\",pod=~\"$pod\"}) by (pod)",
"format": "time_series",
"interval": "",
"intervalFactor": 2,
"legendFormat": "expiring, {{ pod }}",
"metric": "",
"refId": "B",
"step": 240
}
],
"thresholds": [],
"timeFrom": null,
"timeRegions": [],
"timeShift": null,
"title": "Expiring vs Not-Expiring Keys",
"tooltip": {
"msResolution": false,
"shared": true,
"sort": 0,
"value_type": "individual"
},
"type": "graph",
"xaxis": {
"buckets": null,
"mode": "time",
"name": null,
"show": true,
"values": []
},
"yaxes": [
{
"format": "short",
"label": null,
"logBase": 1,
"max": null,
"min": null,
"show": true
},
{
"format": "short",
"label": null,
"logBase": 1,
"max": null,
"min": null,
"show": true
}
],
"yaxis": {
"align": false,
"alignLevel": null
}
},
{
"aliasColors": {
"evicts": "#890F02",
"memcached_items_evicted_total{instance=\"172.17.0.1:9150\",job=\"prometheus\"}": "#890F02",
"reclaims": "#3F6833"
},
"bars": false,
"dashLength": 10,
"dashes": false,
"datasource": "Prometheus",
"editable": true,
"error": false,
"fieldConfig": {
"defaults": {
"custom": {},
"links": []
},
"overrides": []
},
"fill": 1,
"fillGradient": 0,
"grid": {},
"gridPos": {
"h": 7,
"w": 12,
"x": 0,
"y": 21
},
"hiddenSeries": false,
"id": 8,
"isNew": true,
"legend": {
"avg": false,
"current": false,
"max": false,
"min": false,
"show": true,
"total": false,
"values": false
},
"lines": true,
"linewidth": 2,
"links": [],
"nullPointMode": "connected",
"options": {
"alertThreshold": true
},
"percentage": false,
"pluginVersion": "7.4.2",
"pointradius": 5,
"points": false,
"renderer": "flot",
"seriesOverrides": [
{
"alias": "reclaims",
"yaxis": 2
}
],
"spaceLength": 10,
"stack": false,
"steppedLine": false,
"targets": [
{
"expr": "sum(rate(redis_expired_keys_total{service=~\"$service\",pod=~\"$pod\"}[5m])) by (pod)",
"format": "time_series",
"hide": false,
"interval": "",
"intervalFactor": 2,
"legendFormat": "expired, {{ pod }}",
"metric": "",
"refId": "A",
"step": 240,
"target": ""
},
{
"expr": "sum(rate(redis_evicted_keys_total{service=~\"$service\",pod=~\"$pod\"}[5m])) by (pod)",
"format": "time_series",
"interval": "",
"intervalFactor": 2,
"legendFormat": "evicted, {{ pod }}",
"refId": "B",
"step": 240
}
],
"thresholds": [],
"timeFrom": null,
"timeRegions": [],
"timeShift": null,
"title": "Expired/Evicted Keys",
"tooltip": {
"msResolution": false,
"shared": true,
"sort": 0,
"value_type": "cumulative"
},
"type": "graph",
"xaxis": {
"buckets": null,
"mode": "time",
"name": null,
"show": true,
"values": []
},
"yaxes": [
{
"format": "short",
"label": null,
"logBase": 1,
"max": null,
"min": null,
"show": true
},
{
"format": "short",
"label": null,
"logBase": 1,
"max": null,
"min": null,
"show": true
}
],
"yaxis": {
"align": false,
"alignLevel": null
}
},
{
"aliasColors": {},
"bars": false,
"dashLength": 10,
"dashes": false,
"datasource": "Prometheus",
"fieldConfig": {
"defaults": {
"custom": {},
"links": []
},
"overrides": []
},
"fill": 1,
"fillGradient": 0,
"gridPos": {
"h": 7,
"w": 12,
"x": 12,
"y": 21
},
"hiddenSeries": false,
"id": 16,
"legend": {
"avg": false,
"current": false,
"max": false,
"min": false,
"show": true,
"total": false,
"values": false
},
"lines": true,
"linewidth": 1,
"links": [],
"nullPointMode": "null",
"options": {
"alertThreshold": true
},
"percentage": false,
"pluginVersion": "7.4.2",
"pointradius": 2,
"points": false,
"renderer": "flot",
"seriesOverrides": [],
"spaceLength": 10,
"stack": false,
"steppedLine": false,
"targets": [
{
"expr": "sum(redis_connected_clients{service=~\"$service\",pod=~\"$pod\"})",
"format": "time_series",
"intervalFactor": 1,
"legendFormat": "connected",
"refId": "A"
},
{
"expr": "sum(redis_blocked_clients{service=~\"$service\",pod=~\"$pod\"})",
"format": "time_series",
"intervalFactor": 1,
"legendFormat": "blocked",
"refId": "B"
}
],
"thresholds": [],
"timeFrom": null,
"timeRegions": [],
"timeShift": null,
"title": "Connected/Blocked Clients",
"tooltip": {
"shared": true,
"sort": 0,
"value_type": "individual"
},
"type": "graph",
"xaxis": {
"buckets": null,
"mode": "time",
"name": null,
"show": true,
"values": []
},
"yaxes": [
{
"format": "short",
"label": null,
"logBase": 1,
"max": null,
"min": null,
"show": true
},
{
"format": "short",
"label": null,
"logBase": 1,
"max": null,
"min": null,
"show": true
}
],
"yaxis": {
"align": false,
"alignLevel": null
}
},
{
"aliasColors": {},
"bars": false,
"dashLength": 10,
"dashes": false,
"datasource": "Prometheus",
"editable": true,
"error": false,
"fieldConfig": {
"defaults": {
"custom": {},
"links": []
},
"overrides": []
},
"fill": 2,
"fillGradient": 0,
"grid": {},
"gridPos": {
"h": 7,
"w": 12,
"x": 0,
"y": 28
},
"hiddenSeries": false,
"id": 20,
"isNew": true,
"legend": {
"avg": false,
"current": false,
"hideEmpty": false,
"hideZero": true,
"max": false,
"min": false,
"show": true,
"total": false,
"values": false
},
"lines": true,
"linewidth": 1,
"links": [],
"nullPointMode": "connected",
"options": {
"alertThreshold": true
},
"percentage": false,
"pluginVersion": "7.4.2",
"pointradius": 5,
"points": false,
"renderer": "flot",
"seriesOverrides": [],
"spaceLength": 10,
"stack": false,
"steppedLine": false,
"targets": [
{
"expr": "sum(irate(redis_commands_duration_seconds_total{service=~\"$service\",pod=~\"$pod\"}[1m])) by (cmd)\n /\nsum(irate(redis_commands_total{service=~\"$service\",pod=~\"$pod\"}[1m])) by (cmd)\n",
"format": "time_series",
"interval": "",
"intervalFactor": 2,
"legendFormat": "{{ cmd }}",
"metric": "redis_command_calls_total",
"refId": "A",
"step": 240
}
],
"thresholds": [],
"timeFrom": null,
"timeRegions": [],
"timeShift": null,
"title": "Average Time Spent by Command / sec",
"tooltip": {
"msResolution": true,
"shared": true,
"sort": 2,
"value_type": "individual"
},
"type": "graph",
"xaxis": {
"buckets": null,
"mode": "time",
"name": null,
"show": true,
"values": []
},
"yaxes": [
{
"format": "s",
"label": null,
"logBase": 1,
"max": null,
"min": null,
"show": true
},
{
"format": "short",
"label": null,
"logBase": 1,
"max": null,
"min": null,
"show": true
}
],
"yaxis": {
"align": false,
"alignLevel": null
}
},
{
"aliasColors": {},
"bars": false,
"dashLength": 10,
"dashes": false,
"datasource": "Prometheus",
"editable": true,
"error": false,
"fieldConfig": {
"defaults": {
"custom": {},
"links": []
},
"overrides": []
},
"fill": 8,
"fillGradient": 0,
"grid": {},
"gridPos": {
"h": 7,
"w": 12,
"x": 12,
"y": 28
},
"hiddenSeries": false,
"id": 14,
"isNew": true,
"legend": {
"avg": false,
"current": false,
"hideEmpty": false,
"hideZero": false,
"max": false,
"min": false,
"show": true,
"total": false,
"values": false
},
"lines": true,
"linewidth": 1,
"links": [],
"nullPointMode": "connected",
"options": {
"alertThreshold": true
},
"percentage": false,
"pluginVersion": "7.4.2",
"pointradius": 5,
"points": false,
"renderer": "flot",
"seriesOverrides": [],
"spaceLength": 10,
"stack": true,
"steppedLine": false,
"targets": [
{
"expr": "sum(irate(redis_commands_duration_seconds_total{service=~\"$service\",pod=~\"$pod\"}[1m])) by (cmd) != 0",
"format": "time_series",
"interval": "",
"intervalFactor": 2,
"legendFormat": "{{ cmd }}",
"metric": "redis_command_calls_total",
"refId": "A",
"step": 240
}
],
"thresholds": [],
"timeFrom": null,
"timeRegions": [],
"timeShift": null,
"title": "Total Time Spent by Command / sec",
"tooltip": {
"msResolution": true,
"shared": true,
"sort": 2,
"value_type": "individual"
},
"type": "graph",
"xaxis": {
"buckets": null,
"mode": "time",
"name": null,
"show": true,
"values": []
},
"yaxes": [
{
"format": "s",
"label": null,
"logBase": 1,
"max": null,
"min": null,
"show": true
},
{
"format": "short",
"label": null,
"logBase": 1,
"max": null,
"min": null,
"show": true
}
],
"yaxis": {
"align": false,
"alignLevel": null
}
}
],
"refresh": false,
"schemaVersion": 27,
"style": "dark",
"tags": [
"prometheus",
"redis"
],
"templating": {
"list": [
{
"allValue": null,
"current": {
"selected": true,
"text": "lkirulxq-l46-redis-exporter-svc",
"value": "lkirulxq-l46-redis-exporter-svc"
},
"datasource": null,
"definition": "label_values(redis_up,service)",
"description": null,
"error": null,
"hide": 0,
"includeAll": false,
"label": "Service",
"multi": false,
"name": "service",
"options": [],
"query": {
"query": "label_values(redis_up,service)",
"refId": "StandardVariableQuery"
},
"refresh": 1,
"regex": "",
"skipUrlSync": false,
"sort": 1,
"tagValuesQuery": "",
"tags": [],
"tagsQuery": "",
"type": "query",
"useTags": false
},
{
"allValue": null,
"current": {
"selected": false,
"text": "lkirulxq-l46-redis-1",
"value": "lkirulxq-l46-redis-1"
},
"datasource": null,
"definition": "label_values(redis_up{service=\"$service\"},pod)",
"description": null,
"error": null,
"hide": 0,
"includeAll": false,
"label": "Pod",
"multi": false,
"name": "pod",
"options": [],
"query": {
"query": "label_values(redis_up{service=\"$service\"},pod)",
"refId": "StandardVariableQuery"
},
"refresh": 1,
"regex": "",
"skipUrlSync": false,
"sort": 0,
"tagValuesQuery": "",
"tags": [],
"tagsQuery": "",
"type": "query",
"useTags": false
},
{
"auto": false,
"auto_count": 30,
"auto_min": "10s",
"current": {
"selected": false,
"text": "1s",
"value": "1s"
},
"description": null,
"error": null,
"hide": 0,
"label": "Interval",
"name": "interval",
"options": [
{
"selected": true,
"text": "1s",
"value": "1s"
},
{
"selected": false,
"text": "5s",
"value": "5s"
},
{
"selected": false,
"text": "1m",
"value": "1m"
},
{
"selected": false,
"text": "5m",
"value": "5m"
},
{
"selected": false,
"text": "1h",
"value": "1h"
},
{
"selected": false,
"text": "6h",
"value": "6h"
},
{
"selected": false,
"text": "1d",
"value": "1d"
}
],
"query": "1s,5s,1m,5m,1h,6h,1d",
"refresh": 2,
"skipUrlSync": false,
"type": "interval"
}
]
},
"time": {
"from": "now-24h",
"to": "now"
},
"timepicker": {
"refresh_intervals": [
"5s",
"10s",
"30s",
"1m",
"5m",
"15m",
"30m",
"1h",
"2h",
"1d"
],
"time_options": [
"5m",
"15m",
"1h",
"6h",
"12h",
"24h",
"2d",
"7d",
"30d"
]
},
"timezone": "browser",
"title": "Redis Overview",
"uid": "redis",
"version": 6
}
2. 创建 configmaps
kubectl apply configmap redis-dashboard -n prometheus --from-file=redis.json
编辑 configmap 添加 label
kubectl edit cm  redis-dashboards -n prometheus
....
metadata:
  labels:
    grafana_dashboard: "1"
.......
....
3. grafana 界面查看
原文地址:https://blog.csdn.net/xixihahalelehehe/article/details/136532080
免责声明:本站文章内容转载自网络资源,如本站内容侵犯了原著者的合法权益,可联系本站删除。更多内容请关注自学内容网(zxcms.com)!