机器学习预测汽车油耗效率 MPG
流程
- 数据获取
- 导入需要的包
- 引入文件,查看内容
- 划分训练集和测试集
- 调用模型
- 查看准确率
数据获取
链接:https://pan.baidu.com/s/1KeIJykbcVpsfEk0xjhiICA?pwd=30oe
提取码:30oe
--来自百度网盘超级会员V1的分享
导入需要的包
import pandas as pd
import numpy as np
import matplotlib.pyplot as plt
from sklearn.model_selection import train_test_split
from sklearn.linear_model import LinearRegression
引入文件,查看内容
path = 'auto-mpg.data'
columns = ["mpg", "cylinders", "displacement", "horsepower", "weight", "acceleration", "model year", "origin", "car name"]
cars = pd.read_csv(path, delim_whitespace=True, names=columns)
cars.head()

划分训练集和测试集
这里先用重量做特征
Y = cars['mpg']
X = cars[['weight']]
X_train, X_test, Y_train, Y_test = train_test_split(X,Y,test_size=0.2,random_state=0)
引入模型
线性回归
lr = LinearRegression()
lr = lr.fit(X_train,Y_train)
查看准确率
文字
print('score = {}'.format(lr.score(X,Y)))
#score = 0.691680406988993
可视化查看
plt.scatter(X_test, Y_test, color = 'red', alpha=0.3)
plt.scatter(X_test, lr.predict(X_test),color = 'green',alpha=0.3)
plt.xlabel('weight')
plt.ylabel('mpg')
plt.title('test data')
plt.show()
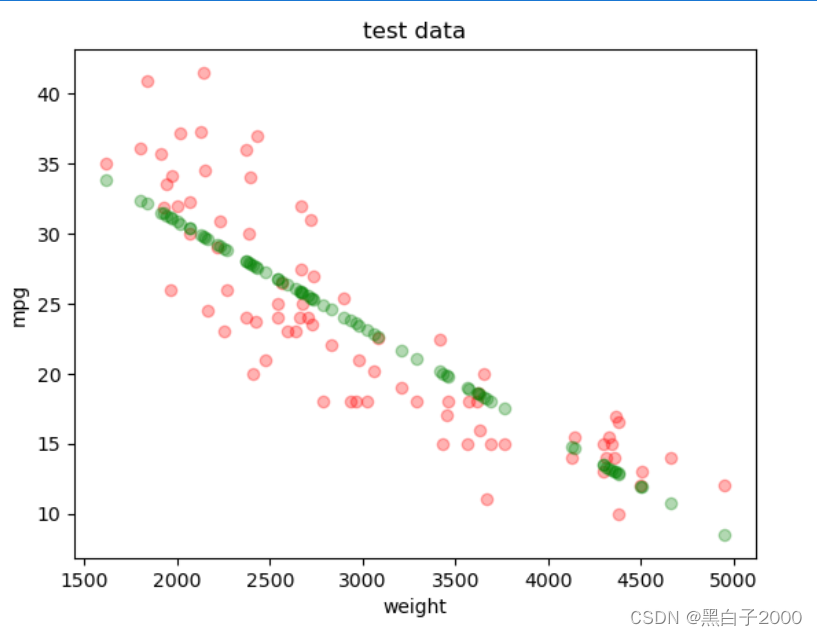
准确率只有0.69因为只用到了weight
此时使用多变量线性回归
选三个变量建模
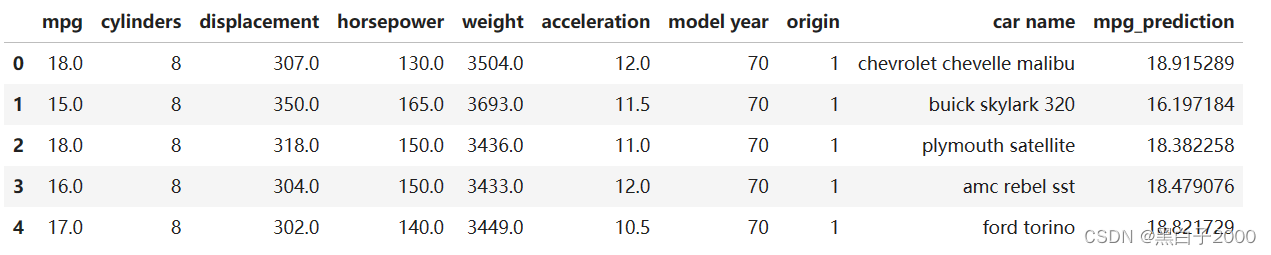
cars = cars[cars.horsepower != '?']
mul = ['weight','horsepower','displacement'] # 选择三个变量进行建立模型
mul_lr = LinearRegression()
mul_lr.fit(cars[mul],cars['mpg']) # 训练模型
cars['mpg_prediction'] = mul_lr.predict(cars[mul])
cars.head()
预测准确率
mul_score = mul_lr.score(cars[mul],cars['mpg'])
mul_score
#0.7069554693444708
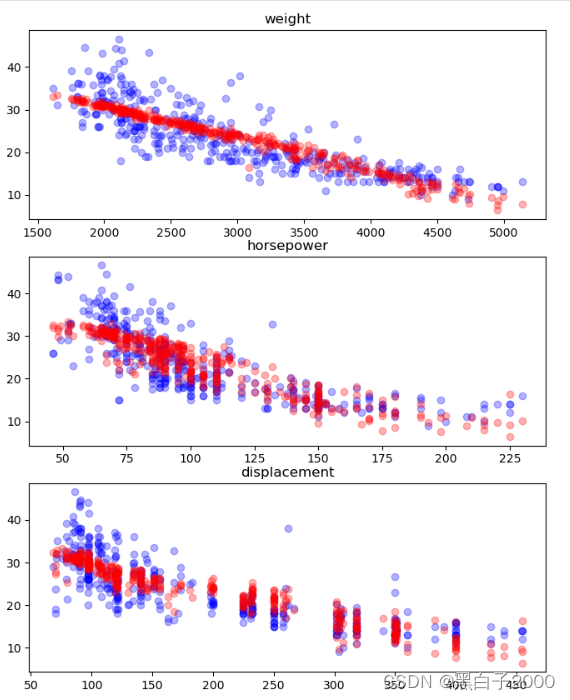
从这里可以看出准确率上升了一个点
fig = plt.figure(figsize = (8,10))
ax1 = fig.add_subplot(3,1,1)
ax2 = fig.add_subplot(3,1,2)
ax3 = fig.add_subplot(3,1,3)
ax1.scatter(cars['weight'], cars['mpg'], c='blue', alpha=0.3)
ax1.scatter(cars['weight'], cars['mpg_prediction'], c='red', alpha=0.3)
ax1.set_title('weight')
ax2.scatter([ float(x) for x in cars['horsepower'].tolist()], cars['mpg'], c='blue', alpha=0.3)
ax2.scatter([ float(x) for x in cars['horsepower'].tolist()], cars['mpg_prediction'], c='red', alpha=0.3)
ax2.set_title('horsepower')
ax3.scatter(cars['displacement'], cars['mpg'], c='blue', alpha=0.3)
ax3.scatter(cars['displacement'], cars['mpg_prediction'], c='red', alpha=0.3)
ax3.set_title('displacement')
plt.show()
原文地址:https://blog.csdn.net/weixin_45079974/article/details/137964592
免责声明:本站文章内容转载自网络资源,如本站内容侵犯了原著者的合法权益,可联系本站删除。更多内容请关注自学内容网(zxcms.com)!