Merlion笔记(一):安装及基本使用
前言
Merlion 是一个用于时间序列智能的 Python 库。它为许多常用 模型和数据集提供了统一的界面,用于单变量和多变量时间序列上的预测、异常检测和变化点检测,以及标准的 预处理和后处理层。它有几个模块来提高易用性,包括可视化、异常分数校准以提高可解释性、 用于超参数调整和模型选择的AutoML以及模型集成。Merlion 还提供了一个独特的评估框架 ,可以模拟生产中模型的实时部署和重新训练。该库旨在为工程师和研究人员提供一站式解决方案,以快速开发满足其特定时间序列需求的模型,并在多个时间序列数据集中对它们进行基准测试。
安装视频教程:时间序列Python包:merlion安装
官方文档:https://opensource.salesforce.com/Merlion/v2.0.2/index.html#
GitHub链接:https://github.com/salesforce/Merlion?tab=readme-ov-file
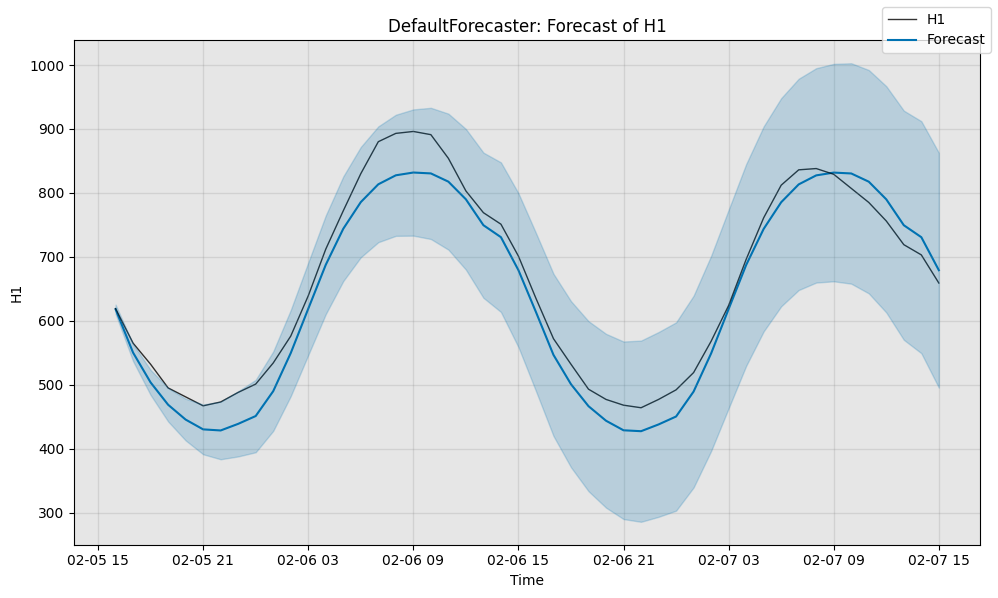
运行以下GitHub给的示例代码,验证是否安装成功:(运行不成功我直接吃!)
from merlion.utils import TimeSeries
from ts_datasets.forecast import M4

# Data loader returns pandas DataFrames, which we convert to Merlion TimeSeries
time_series, metadata = M4(subset="Hourly")[0]
train_data = TimeSeries.from_pd(time_series[metadata.trainval])
test_data = TimeSeries.from_pd(time_series[~metadata.trainval])
from merlion.models.defaults import DefaultForecasterConfig, DefaultForecaster
model = DefaultForecaster(DefaultForecasterConfig())
model.train(train_data=train_data)
test_pred, test_err = model.forecast(time_stamps=test_data.time_stamps)
import matplotlib.pyplot as plt
fig, ax = model.plot_forecast(
    time_series=test_data, plot_forecast_uncertainty=True)
plt.show()
# Evaluate the model's predictions quantitatively
from scipy.stats import norm
from merlion.evaluate.forecast import ForecastMetric

# Compute the sMAPE of the predictions (0 to 100, smaller is better)
smape = ForecastMetric.sMAPE.value(ground_truth=test_data, predict=test_pred)

# Compute the MSIS of the model's 95% confidence interval (0 to 100, smaller is better)
lb = TimeSeries.from_pd(
    test_pred.to_pd() + norm.ppf(0.025) * test_err.to_pd().values)
ub = TimeSeries.from_pd(
    test_pred.to_pd() + norm.ppf(0.975) * test_err.to_pd().values)
msis = ForecastMetric.MSIS.value(ground_truth=test_data, predict=test_pred,
                                 insample=train_data, lb=lb, ub=ub)
print(f"sMAPE: {smape:.4f}, MSIS: {msis:.4f}")
sMAPE: 4.9849, MSIS: 19.3177
1 基础
1.1 Merlion的数据格式
本笔记本将使用 Merlion 的 UnivariateTimeSeries 和 TimeSeries 类。这些类是整个仓库中使用的核心数据格式。一般来说,可以将每个 TimeSeries 视为 UnivariateTimeSeries 对象的集合,每个变量对应一个 UnivariateTimeSeries 对象。
import pandas as pd

df = pd.read_csv('E:\Merlion\data\example.csv')
df.head()
| timestamp_millis | kpi | kpi_label | |
|---|---|---|---|
| 0 | 1583140320000 | 667.118 | 0 |
| 1 | 1583140380000 | 611.751 | 0 |
| 2 | 1583140440000 | 599.456 | 0 |
| 3 | 1583140500000 | 621.446 | 0 |
| 4 | 1583140560000 | 1418.234 | 0 |
timestamp_millis 列包含 Unix 时间戳(单位为毫秒),kpi 列包含每个时间戳对应的时间序列指标值。我们还将创建一个以时间为索引的该数据框版本:
time_idx_df = df.copy()
time_idx_df["timestamp_millis"] = pd.to_datetime(time_idx_df["timestamp_millis"], unit="ms")
time_idx_df = time_idx_df.set_index("timestamp_millis")
time_idx_df.head()
| kpi | kpi_label | |
|---|---|---|
| timestamp_millis | ||
| 2020-03-02 09:12:00 | 667.118 | 0 |
| 2020-03-02 09:13:00 | 611.751 | 0 |
| 2020-03-02 09:14:00 | 599.456 | 0 |
| 2020-03-02 09:15:00 | 621.446 | 0 |
| 2020-03-02 09:16:00 | 1418.234 | 0 |
1.1.1 UnivariateTimeSeries
初始化 UnivariateTimeSeries 最直观的方式是使用其构造函数。构造函数接受两个参数:time_stamps,即一个包含 Unix 时间戳(单位为秒)或日期时间对象的列表;以及 values,即一个包含实际时间序列值的列表。你也可以选择性地提供一个 name 参数。
from merlion.utils import UnivariateTimeSeries # 单变量时间序列

kpi = UnivariateTimeSeries(
    time_stamps=df.timestamp_millis/1000,  # timestamps in units of seconds
    values=df.kpi,                         # time series values
    name="kpi"                             # optional: a name for this univariate
)

kpi_label = UnivariateTimeSeries(
    time_stamps=df.timestamp_millis/1000,  # timestamps in units of seconds
    values=df.kpi_label                    # time series values
)
或者,你可以直接从一个以时间为索引的 pd.Series 初始化 UnivariateTimeSeries:
kpi_equivalent = UnivariateTimeSeries.from_pd(time_idx_df.kpi)
print(f"Are the two UnivariateTimeSeries equal? {(kpi == kpi_equivalent).all()}")
Are the two UnivariateTimeSeries equal? True
kpi
time
2020-03-02 09:12:00     667.118
2020-03-02 09:13:00     611.751
2020-03-02 09:14:00     599.456
2020-03-02 09:15:00     621.446
2020-03-02 09:16:00    1418.234
                         ...
2020-05-01 23:46:00     874.214
2020-05-01 23:47:00     937.929
2020-05-01 23:48:00    1031.279
2020-05-01 23:49:00    1099.698
2020-05-01 23:50:00     935.405
Name: kpi, Length: 86807, dtype: float64
你也可以将 UnivariateTimeSeries 转换回常规的 pd.Series,方法如下:
print(f"type(kpi.to_pd()) = {type(kpi.to_pd())}")
type(kpi.to_pd()) = <class 'pandas.core.series.Series'>
你可以分别访问时间戳(作为时间戳或日期时间对象)和对应的值:
# Get the Unix timestamps (first 5 for brevity)
print(kpi.time_stamps[:5])
[1583140320.0, 1583140380.0, 1583140440.0, 1583140500.0, 1583140560.0]
# Get the datetimes (this is just the index of the UnivariateTimeSeries,
# since we inherit from pd.Series)
print(kpi.index[:5])
DatetimeIndex(['2020-03-02 09:12:00', '2020-03-02 09:13:00',
               '2020-03-02 09:14:00', '2020-03-02 09:15:00',
               '2020-03-02 09:16:00'],
              dtype='datetime64[ns]', name='time', freq=None)
# Get the values
print(kpi.values[:5])
[667.118, 611.751, 599.456, 621.446, 1418.234]
你可以对 UnivariateTimeSeries 进行索引,以获取一个 (时间戳, 值) 的元组:
print(f"kpi[0] = {kpi[0]}")
kpi[0] = (1583140320.0, 667.118)
如果使用切片索引,你将获得一个新的 UnivariateTimeSeries:
print(f"type(kpi[1:5]) = {type(kpi[1:5])}\n")
print(f"kpi[1:5] = \n\n{kpi[1:5]}")
type(kpi[1:5]) = <class 'merlion.utils.time_series.UnivariateTimeSeries'>

kpi[1:5] =

time
2020-03-02 09:13:00     611.751
2020-03-02 09:14:00     599.456
2020-03-02 09:15:00     621.446
2020-03-02 09:16:00    1418.234
Name: kpi, dtype: float64
迭代 UnivariateTimeSeries 时,将会迭代 (时间戳, 值) 的元组:
for t, x in kpi[:5]:
    print((t, x))
(1583140320.0, 667.118)
(1583140380.0, 611.751)
(1583140440.0, 599.456)
(1583140500.0, 621.446)
(1583140560.0, 1418.234)
1.1.2 TimeSeries
因为 Merlion 是一个通用库,处理单变量和多变量时间序列,我们的标准数据类是 TimeSeries。该类充当一组 UnivariateTimeSeries 的包装器。我们选择这种格式而不是基于向量的方法,因为这种方法在处理缺失值或不同单变量以不同速率采样时要更加稳健。
初始化 TimeSeries 最直观的方法是使用其构造函数,该构造函数接受一个 UnivariateTimeSeries 的集合(列表或(有序)字典)作为唯一参数:
from collections import OrderedDict
from merlion.utils import TimeSeries

time_series_list = TimeSeries(univariates=[kpi.copy(), kpi_label.copy()])
time_series_dict = TimeSeries(
    univariates=OrderedDict([("kpi_renamed", kpi.copy()),
                             ("kpi_label", kpi_label.copy())]))
更常见的是,你可以从 pd.DataFrame 初始化 TimeSeries,并将 TimeSeries 转换为 pd.DataFrame,方法如下:
time_series = TimeSeries.from_pd(time_idx_df) # 这种较直观
print(f"type(TimeSeries.from_pd(time_idx_df)) = {type(time_series)}\n")

recovered_time_idx_df = time_series.to_pd()
print("(recovered_time_idx_df == time_idx_df).all()")
print((recovered_time_idx_df == time_idx_df).all())
type(TimeSeries.from_pd(time_idx_df)) = <class 'merlion.utils.time_series.TimeSeries'>

(recovered_time_idx_df == time_idx_df).all()
kpi          True
kpi_label    True
dtype: bool
我们可以通过 time_series.names 访问各个单变量的名称,通过 time_series.univariates[name] 访问特定的单变量,并通过 for univariate in time_series.univariates 迭代单变量。具体如下:
# When we use a list of univariates, we retain the names of the univariates
# where possible. If a univariate is unnamed, we set its name to its integer
# index in the list of all univariates given. Here, kpi_label was
# originally unnamed, so we set its name to 1
print(time_series_list.names)
['kpi', 'kpi_label']
# If we pass a dictionary instead of a list, all univariates will have
# their specified names. The order is retained from the OrderedDict.
print(time_series_dict.names)
['kpi_renamed', 'kpi_label']
# We can access the KPI like so:
kpi1 = time_series_list.univariates["kpi"]
kpi2 = time_series_dict.univariates["kpi_renamed"]

# kpi1 and kpi2 are the same univariate, just with different names
assert (kpi1 == kpi2).all()
# We can iterate over all univariates like so:
for univariate in time_series_dict.univariates:
    print(univariate)
    print()
time
2020-03-02 09:12:00     667.118
2020-03-02 09:13:00     611.751
2020-03-02 09:14:00     599.456
2020-03-02 09:15:00     621.446
2020-03-02 09:16:00    1418.234
                         ...
2020-05-01 23:46:00     874.214
2020-05-01 23:47:00     937.929
2020-05-01 23:48:00    1031.279
2020-05-01 23:49:00    1099.698
2020-05-01 23:50:00     935.405
Name: kpi_renamed, Length: 86807, dtype: float64

time
2020-03-02 09:12:00    0.0
2020-03-02 09:13:00    0.0
2020-03-02 09:14:00    0.0
2020-03-02 09:15:00    0.0
2020-03-02 09:16:00    0.0
                      ...
2020-05-01 23:46:00    0.0
2020-05-01 23:47:00    0.0
2020-05-01 23:48:00    0.0
2020-05-01 23:49:00    0.0
2020-05-01 23:50:00    0.0
Name: kpi_label, Length: 86807, dtype: float64
# We can also iterate over all univariates & names like so:
for name, univariate in time_series_dict.items():
    print(f"Univariate {name}")
    print(univariate)
    print()
Univariate kpi_renamed
time
2020-03-02 09:12:00     667.118
2020-03-02 09:13:00     611.751
2020-03-02 09:14:00     599.456
2020-03-02 09:15:00     621.446
2020-03-02 09:16:00    1418.234
                         ...
2020-05-01 23:46:00     874.214
2020-05-01 23:47:00     937.929
2020-05-01 23:48:00    1031.279
2020-05-01 23:49:00    1099.698
2020-05-01 23:50:00     935.405
Name: kpi_renamed, Length: 86807, dtype: float64

Univariate kpi_label
time
2020-03-02 09:12:00    0.0
2020-03-02 09:13:00    0.0
2020-03-02 09:14:00    0.0
2020-03-02 09:15:00    0.0
2020-03-02 09:16:00    0.0
                      ...
2020-05-01 23:46:00    0.0
2020-05-01 23:47:00    0.0
2020-05-01 23:48:00    0.0
2020-05-01 23:49:00    0.0
2020-05-01 23:50:00    0.0
Name: kpi_label, Length: 86807, dtype: float64
1.1.3 时间序列索引与对齐
在 Merlion 中,时间序列对齐是一个重要概念。如果一个时间序列的所有单变量在相同的时间戳上进行采样,则称为对齐的。下面将展示一些对齐和不对齐的时间序列示例:
aligned = TimeSeries({"kpi": kpi.copy(), "kpi_label": kpi_label.copy()})
print(f"Is aligned? {aligned.is_aligned}")
Is aligned? True
not_aligned = TimeSeries({"kpi": kpi[1:],                # 2020-03-02 09:13:00 to 2020-05-01 23:50:00
                          "kpi_label": kpi_label[:-1]})  # 2020-03-02 09:12:00 to 2020-05-01 23:49:00
print(f"Is aligned? {not_aligned.is_aligned}")
Is aligned? False
如果你的时间序列是对齐的,你可以使用整数索引来获取一个元组 (时间戳, (值_1, ..., 值_k)),或者使用切片索引来获取一个子时间序列:
aligned[0]
(1583140320.0, (667.118, 0.0))
print(f"type(aligned[1:5]) = {type(aligned[1:5])}\n")
print(f"aligned[1:5] = \n{aligned[1:5]}")
type(aligned[1:5]) = <class 'merlion.utils.time_series.TimeSeries'>

aligned[1:5] =
                          kpi  kpi_label
time
2020-03-02 09:13:00   611.751        0.0
2020-03-02 09:14:00   599.456        0.0
2020-03-02 09:15:00   621.446        0.0
2020-03-02 09:16:00  1418.234        0.0
你也可以像这样迭代对齐的时间序列:for timestamp, (值_1, ..., 值_k) in time_series:
for t, (x1, x2) in aligned[:5]:
    print((t, (x1, x2)))
(1583140320.0, (667.118, 0.0))
(1583140380.0, (611.751, 0.0))
(1583140440.0, (599.456, 0.0))
(1583140500.0, (621.446, 0.0))
(1583140560.0, (1418.234, 0.0))
请注意,如果你尝试对未对齐的时间序列执行任何这些操作,Merlion 将抛出错误!例如:
try:
    not_aligned[0]
except RuntimeError as e:
    print(f"{type(e).__name__}: {e}")
RuntimeError: The univariates comprising this time series are not aligned (they have different time stamps), but alignment is required to index into the time series.
你仍然可以获取不对齐时间序列的长度或形状,但 Merlion 会发出警告。
print(len(not_aligned))
d:\ANACONDA\envs\merlion\lib\site-packages\merlion\utils\time_series.py:642: UserWarning: The univariates comprising this time series are not aligned (they have different time stamps). The length returned is equal to the length of the _union_ of all time stamps present in any of the univariates.
  warnings.warn(warning)
The univariates comprising this time series are not aligned (they have different time stamps). The length returned is equal to the length of the _union_ of all time stamps present in any of the univariates.


86807
print(not_aligned.shape)
The univariates comprising this time series are not aligned (they have different time stamps). The length returned is equal to the length of the _union_ of all time stamps present in any of the univariates.


(2, 86807)
不过,你可以调用 time_series.align() 自动重新采样时间序列的各个单变量,以使其对齐。默认情况下,这将取所有单变量中存在的时间戳的并集,但这一行为是可自定义的。
print(f"Is not_aligned.align() aligned? {not_aligned.align().is_aligned}")
Is not_aligned.align() aligned? True
1.1.4 TimeSeries:一些有用的特征
在 API 文档中提供了有关 merlion.utils.time_series.TimeSeries 类的更多信息,但在这里我们强调两个额外的有用功能。这些功能无论时间序列是否对齐都可以使用!
你可以通过调用 time_series.window(t0, tf) 获取时间序列在时间 t0 和 tf 之间的子集。t0 和 tf 可以是任何合理格式的日期时间或 Unix 时间戳。
aligned.window("2020-03-05 12:00:00", pd.Timestamp(year=2020, month=4, day=1)) # 默认不包括右边界
                          kpi  kpi_label
time
2020-03-05 12:00:00  1166.819        0.0
2020-03-05 12:01:00  1345.504        0.0
2020-03-05 12:02:00  1061.391        0.0
2020-03-05 12:03:00  1260.874        0.0
2020-03-05 12:04:00  1202.009        0.0
...                       ...        ...
2020-03-31 23:55:00  1154.397        0.0
2020-03-31 23:56:00  1270.292        0.0
2020-03-31 23:57:00  1160.761        0.0
2020-03-31 23:58:00  1082.076        0.0
2020-03-31 23:59:00  1167.297        0.0

[38160 rows x 2 columns]
# Note that the first value of the KPI (which is missing in not_aligned) is NaN
not_aligned.window(1583140320, 1583226720)
                          kpi  kpi_label
time
2020-03-02 09:12:00       NaN        0.0
2020-03-02 09:13:00   611.751        0.0
2020-03-02 09:14:00   599.456        0.0
2020-03-02 09:15:00   621.446        0.0
2020-03-02 09:16:00  1418.234        0.0
...                       ...        ...
2020-03-03 09:07:00  1132.564        0.0
2020-03-03 09:08:00  1087.037        0.0
2020-03-03 09:09:00   984.432        0.0
2020-03-03 09:10:00  1085.008        0.0
2020-03-03 09:11:00  1020.937        0.0

[1440 rows x 2 columns]
你还可以在任何时间戳处将时间序列切割为左侧和右侧两部分。
left, right = aligned.bisect("2020-05-01") # 切割时间点的数据默认在右侧
print(f"Left\n{left}\n")
print()
print(f"Right\n{right}\n")
Left
                          kpi  kpi_label
time
2020-03-02 09:12:00   667.118        0.0
2020-03-02 09:13:00   611.751        0.0
2020-03-02 09:14:00   599.456        0.0
2020-03-02 09:15:00   621.446        0.0
2020-03-02 09:16:00  1418.234        0.0
...                       ...        ...
2020-04-30 23:55:00  1296.091        0.0
2020-04-30 23:56:00  1323.743        0.0
2020-04-30 23:57:00  1203.672        0.0
2020-04-30 23:58:00  1278.720        0.0
2020-04-30 23:59:00  1217.877        0.0

[85376 rows x 2 columns]
Right
kpi kpi_label
time
2020-05-01 00:00:00 1381.110 0.0
2020-05-01 00:01:00 1807.039 0.0
2020-05-01 00:02:00 1833.385 0.0
2020-05-01 00:03:00 1674.412 0.0
2020-05-01 00:04:00 1683.194 0.0
… … …
2020-05-01 23:46:00 874.214 0.0
2020-05-01 23:47:00 937.929 0.0
2020-05-01 23:48:00 1031.279 0.0
2020-05-01 23:49:00 1099.698 0.0
2020-05-01 23:50:00 935.405 0.0
[1431 rows x 2 columns]
1.2 加载自定义数据集
本笔记本将解释如何加载 CSV 文件以用于异常检测或预测。
1.2.1 异常检测数据集
让我们首先看一个合成的异常检测数据集。请注意,这一部分只是提供了数据集 ts_datasets.anomaly.Synthetic 的替代实现。我们首先列出相关目录中的所有 CSV 文件。
import glob
anom_dir = 'E:\Merlion\data\synthetic_anomaly'
csvs = sorted(glob.glob(f"{anom_dir}/*.csv"))
for csv in csvs:
    print(csv)
E:\Merlion\data\synthetic_anomaly\horizontal.csv
E:\Merlion\data\synthetic_anomaly\horizontal_dip_anomaly.csv
E:\Merlion\data\synthetic_anomaly\horizontal_level_anomaly.csv
E:\Merlion\data\synthetic_anomaly\horizontal_shock_anomaly.csv
E:\Merlion\data\synthetic_anomaly\horizontal_spike_anomaly.csv
E:\Merlion\data\synthetic_anomaly\horizontal_trend_anomaly.csv
E:\Merlion\data\synthetic_anomaly\seasonal.csv
E:\Merlion\data\synthetic_anomaly\seasonal_dip_anomaly.csv
E:\Merlion\data\synthetic_anomaly\seasonal_level_anomaly.csv
E:\Merlion\data\synthetic_anomaly\seasonal_shock_anomaly.csv
E:\Merlion\data\synthetic_anomaly\seasonal_spike_anomaly.csv
E:\Merlion\data\synthetic_anomaly\seasonal_trend_anomaly.csv
E:\Merlion\data\synthetic_anomaly\upward_downward.csv
E:\Merlion\data\synthetic_anomaly\upward_downward_dip_anomaly.csv
E:\Merlion\data\synthetic_anomaly\upward_downward_level_anomaly.csv
E:\Merlion\data\synthetic_anomaly\upward_downward_shock_anomaly.csv
E:\Merlion\data\synthetic_anomaly\upward_downward_spike_anomaly.csv
E:\Merlion\data\synthetic_anomaly\upward_downward_trend_anomaly.csv
查看一下几个 CSV 文件。
import pandas as pd
from IPython.display import display

for csv in [csvs[0], csvs[8]]:
    print(csv)
    display(pd.read_csv(csv))
E:\Merlion\data\synthetic_anomaly\horizontal.csv
| timestamp | horizontal | |
|---|---|---|
| 0 | 0 | 1.928031 |
| 1 | 300 | -1.156620 |
| 2 | 600 | -0.390650 |
| 3 | 900 | 0.400804 |
| 4 | 1200 | -0.874490 |
| ... | ... | ... |
| 9995 | 2998500 | 0.362724 |
| 9996 | 2998800 | 2.657373 |
| 9997 | 2999100 | 1.472341 |
| 9998 | 2999400 | 1.033154 |
| 9999 | 2999700 | 2.950466 |
10000 rows × 2 columns
E:\Merlion\data\synthetic_anomaly\seasonal_level_anomaly.csv
| timestamp | seasonal | anomaly | |
|---|---|---|---|
| 0 | 0 | -0.577883 | 0.0 |
| 1 | 300 | 1.059779 | 0.0 |
| 2 | 600 | 1.137609 | 0.0 |
| 3 | 900 | 0.743360 | 0.0 |
| 4 | 1200 | 1.998400 | 0.0 |
| ... | ... | ... | ... |
| 9995 | 2998500 | -5.388685 | 0.0 |
| 9996 | 2998800 | -5.017828 | 0.0 |
| 9997 | 2999100 | -4.196791 | 0.0 |
| 9998 | 2999400 | -4.234555 | 0.0 |
| 9999 | 2999700 | -3.111685 | 0.0 |
10000 rows × 3 columns
该数据集中每个 CSV 文件具有以下重要特征:
- 一个时间列
timestamp(在这里是以秒为单位表示的 Unix 时间戳); - 一列
anomaly,指示某个时间戳是否为异常(对于不包含异常的时间序列,此列可能缺失); - 一个或多个列用于实际数据值。
我们可以按如下方式为该数据集中的所有 CSV 文件创建数据加载器:
from ts_datasets.anomaly import CustomAnomalyDataset

dataset = CustomAnomalyDataset(
    rootdir=anom_dir,       # 数据存储的路径
    test_frac=0.75,         # 使用每个时间序列的 75% 进行测试。如果实际 CSV 中包含 `trainval` 列,则此设置会被覆盖。
    time_unit="s",          # 时间戳列(自动检测)以秒为单位
    assume_no_anomaly=True  # 如果在没有找到 "anomaly" 列,且 assume_no_anomaly 的值为 True,那么认为数据中没有异常;如果 assume_no_anomaly 的值为 False,则会抛出一个异常(错误)
)
print(f"There are {len(dataset)} time series in this dataset.")
time_series, metadata = dataset[3]
There are 18 time series in this dataset.
这个特定的time_series是单变量的。它的变量名为“horizontal”。
display(time_series)
| horizontal | |
|---|---|
| timestamp | |
| 1970-01-01 00:00:00 | 1.928031 |
| 1970-01-01 00:05:00 | -1.156620 |
| 1970-01-01 00:10:00 | -0.390650 |
| 1970-01-01 00:15:00 | 0.400804 |
| 1970-01-01 00:20:00 | -0.874490 |
| ... | ... |
| 1970-02-04 16:55:00 | 0.362724 |
| 1970-02-04 17:00:00 | 2.657373 |
| 1970-02-04 17:05:00 | 1.472341 |
| 1970-02-04 17:10:00 | 1.033154 |
| 1970-02-04 17:15:00 | 2.950466 |
10000 rows × 1 columns
metadata与time_series具有相同的时间戳。它包含“anomaly”和“trainval”列。这两列分别指示每个时间戳是否为异常,以及每个时间戳是用于训练/验证还是测试。
display(metadata)
| anomaly | trainval | |
|---|---|---|
| timestamp | ||
| 1970-01-01 00:00:00 | False | True |
| 1970-01-01 00:05:00 | False | True |
| 1970-01-01 00:10:00 | False | True |
| 1970-01-01 00:15:00 | False | True |
| 1970-01-01 00:20:00 | False | True |
| ... | ... | ... |
| 1970-02-04 16:55:00 | False | False |
| 1970-02-04 17:00:00 | False | False |
| 1970-02-04 17:05:00 | False | False |
| 1970-02-04 17:10:00 | False | False |
| 1970-02-04 17:15:00 | False | False |
10000 rows × 2 columns
print(f"{100 - metadata.trainval.mean() * 100}% of the time series is for testing.")
print(f"{metadata.anomaly.mean() * 100}% of the time series is anomalous.")
75.0% of the time series is for testing.
19.57% of the time series is anomalous.
1.2.2 通用(预测)数据集
接下来,让我们加载一个更通用的预测数据集。在这个过程中,我们还将展示一些更高级的功能。这里,我们的数据集是一个包含多个变量的时间序列 CSV 文件。这些时间序列来自一家大型零售商,每个单独的时间序列对应于不同商店中的不同部门。让我们来看看这些数据。
csv = 'E:\Merlion\data\walmart\walmart_mini.csv'
display(pd.read_csv(csv))
| Store | Dept | Date | Weekly_Sales | Temperature | Fuel_Price | MarkDown1 | MarkDown2 | MarkDown3 | MarkDown4 | MarkDown5 | CPI | Unemployment | IsHoliday | |
|---|---|---|---|---|---|---|---|---|---|---|---|---|---|---|
| 0 | 1 | 1 | 2010-02-05 | 24924.50 | 42.31 | 2.572 | NaN | NaN | NaN | NaN | NaN | 211.096358 | 8.106 | False |
| 1 | 1 | 1 | 2010-02-12 | 46039.49 | 38.51 | 2.548 | NaN | NaN | NaN | NaN | NaN | 211.242170 | 8.106 | True |
| 2 | 1 | 1 | 2010-02-19 | 41595.55 | 39.93 | 2.514 | NaN | NaN | NaN | NaN | NaN | 211.289143 | 8.106 | False |
| 3 | 1 | 1 | 2010-02-26 | 19403.54 | 46.63 | 2.561 | NaN | NaN | NaN | NaN | NaN | 211.319643 | 8.106 | False |
| 4 | 1 | 1 | 2010-03-05 | 21827.90 | 46.50 | 2.625 | NaN | NaN | NaN | NaN | NaN | 211.350143 | 8.106 | False |
| ... | ... | ... | ... | ... | ... | ... | ... | ... | ... | ... | ... | ... | ... | ... |
| 2855 | 2 | 10 | 2012-09-28 | 37104.67 | 79.45 | 3.666 | 7106.05 | 1.91 | 1.65 | 1549.10 | 3946.03 | 222.616433 | 6.565 | False |
| 2856 | 2 | 10 | 2012-10-05 | 36361.28 | 70.27 | 3.617 | 6037.76 | NaN | 10.04 | 3027.37 | 3853.40 | 222.815930 | 6.170 | False |
| 2857 | 2 | 10 | 2012-10-12 | 35332.34 | 60.97 | 3.601 | 2145.50 | NaN | 33.31 | 586.83 | 10421.01 | 223.015426 | 6.170 | False |
| 2858 | 2 | 10 | 2012-10-19 | 35721.09 | 68.08 | 3.594 | 4461.89 | NaN | 1.14 | 1579.67 | 2642.29 | 223.059808 | 6.170 | False |
| 2859 | 2 | 10 | 2012-10-26 | 34260.76 | 69.79 | 3.506 | 6152.59 | 129.77 | 200.00 | 272.29 | 2924.15 | 223.078337 | 6.170 | False |
2860 rows × 14 columns
与之前一样,我们有一列 Date 表示时间。请注意,在这种情况下,这是字符串格式而不是时间戳。不过,我们现在还增加了一些索引列 Store 和 Dept,用于区分不同的时间序列。我们需要将这些列指定给数据加载器。
from ts_datasets.forecast import CustomDataset
dataset = CustomDataset(
    rootdir=csv,                  # where the data is stored
    index_cols=["Store", "Dept"], # Individual time series are indexed by store & department
    test_frac=0.75,               # use 75% of each time series for testing. overridden if the column `trainval` is in the actual CSV.
)
print(f"There are {len(dataset)} time series in this dataset.")
time_series, metadata = dataset[17]
There are 20 time series in this dataset.
display(time_series)
| Weekly_Sales | Temperature | Fuel_Price | MarkDown1 | MarkDown2 | MarkDown3 | MarkDown4 | MarkDown5 | CPI | Unemployment | IsHoliday | |
|---|---|---|---|---|---|---|---|---|---|---|---|
| Date | |||||||||||
| 2010-02-05 | 69634.80 | 40.19 | 2.572 | NaN | NaN | NaN | NaN | NaN | 210.752605 | 8.324 | False |
| 2010-02-12 | 63393.29 | 38.49 | 2.548 | NaN | NaN | NaN | NaN | NaN | 210.897994 | 8.324 | True |
| 2010-02-19 | 66589.27 | 39.69 | 2.514 | NaN | NaN | NaN | NaN | NaN | 210.945160 | 8.324 | False |
| 2010-02-26 | 61875.48 | 46.10 | 2.561 | NaN | NaN | NaN | NaN | NaN | 210.975957 | 8.324 | False |
| 2010-03-05 | 67041.18 | 47.17 | 2.625 | NaN | NaN | NaN | NaN | NaN | 211.006754 | 8.324 | False |
| ... | ... | ... | ... | ... | ... | ... | ... | ... | ... | ... | ... |
| 2012-09-28 | 57424.00 | 79.45 | 3.666 | 7106.05 | 1.91 | 1.65 | 1549.10 | 3946.03 | 222.616433 | 6.565 | False |
| 2012-10-05 | 62955.51 | 70.27 | 3.617 | 6037.76 | NaN | 10.04 | 3027.37 | 3853.40 | 222.815930 | 6.170 | False |
| 2012-10-12 | 63083.63 | 60.97 | 3.601 | 2145.50 | NaN | 33.31 | 586.83 | 10421.01 | 223.015426 | 6.170 | False |
| 2012-10-19 | 60502.97 | 68.08 | 3.594 | 4461.89 | NaN | 1.14 | 1579.67 | 2642.29 | 223.059808 | 6.170 | False |
| 2012-10-26 | 63992.36 | 69.79 | 3.506 | 6152.59 | 129.77 | 200.00 | 272.29 | 2924.15 | 223.078337 | 6.170 | False |
143 rows × 11 columns
metadata与time_series具有相同的时间戳。它包含与之前相同trainval列,以及索引列Store和Dept。
display(metadata)
| trainval | Store | Dept | |
|---|---|---|---|
| Date | |||
| 2010-02-05 | True | 2 | 8 |
| 2010-02-12 | True | 2 | 8 |
| 2010-02-19 | True | 2 | 8 |
| 2010-02-26 | True | 2 | 8 |
| 2010-03-05 | True | 2 | 8 |
| ... | ... | ... | ... |
| 2012-09-28 | False | 2 | 8 |
| 2012-10-05 | False | 2 | 8 |
| 2012-10-12 | False | 2 | 8 |
| 2012-10-19 | False | 2 | 8 |
| 2012-10-26 | False | 2 | 8 |
143 rows × 3 columns
print(f"{100 - metadata.trainval.mean() * 100}% of the time series is for testing.")
74.82517482517483% of the time series is for testing.
1.2.3 更广泛的启示
通常,一个数据集可以包含存储在单个根目录下的任意数量的 CSV 文件。每个 CSV 文件可以包含一个或多个时间序列,其中同一个文件内的不同时间序列通过索引列的不同值来指示。请注意,这同样适用于异常检测!您只需要确保您的 CSV 文件都包含异常列。一般来说,只要您的 CSV 文件具有异常列,CustomDataset 支持的所有特征也都支持 CustomAnomalyDataset。
如果您想使用上述任一自定义数据集进行基准测试,可以调用:(在jupyter notebook中运行)(咱也不知道这个报错怎么解决)
!python E:/Merlion/benchmark_anomaly.py --model IsolationForest --retrain_freq 7d --dataset CustomAnomalyDataset --data_root E:/Merlion/data/synthetic_anomaly --data_kwargs "{\"assume_no_anomaly\": true, \"test_frac\": 0.75}"
Training model IsolationForest...
  0%|          | 0/18 [00:00<?, ?it/s]

TSADEvaluator:   0%|          | 0/2249700 [00:00<?, ?it/s][A

TSADEvaluator:  54%|█████▍    | 1209600/2249700 [00:00<00:00, 2114140.63it/s][A

TSADEvaluator:  81%|████████  | 1814400/2249700 [00:01<00:00, 1352591.28it/s][A

TSADEvaluator: 100%|██████████| 2249700/2249700 [00:02<00:00, 949534.31it/s] [A
TSADEvaluator: 100%|██████████| 2249700/2249700 [00:02<00:00, 1112013.20it/s]

  0%|          | 0/18 [00:02<?, ?it/s]
Traceback (most recent call last):
  File "E:\Merlion\benchmark_anomaly.py", line 732, in <module>
    main()
  File "E:\Merlion\benchmark_anomaly.py", line 671, in main
    train_model(
  File "E:\Merlion\benchmark_anomaly.py", line 354, in train_model
    ts_df.loc[:, "timestamp"] = ts_df.index.view(int) // 1e9
  File "d:\ANACONDA\envs\merlion\lib\site-packages\pandas\core\indexing.py", line 911, in __setitem__
    iloc._setitem_with_indexer(indexer, value, self.name)
  File "d:\ANACONDA\envs\merlion\lib\site-packages\pandas\core\indexing.py", line 1857, in _setitem_with_indexer
    self.obj[key] = value
  File "d:\ANACONDA\envs\merlion\lib\site-packages\pandas\core\frame.py", line 4311, in __setitem__
    self._set_item(key, value)
  File "d:\ANACONDA\envs\merlion\lib\site-packages\pandas\core\frame.py", line 4524, in _set_item
    value, refs = self._sanitize_column(value)
  File "d:\ANACONDA\envs\merlion\lib\site-packages\pandas\core\frame.py", line 5266, in _sanitize_column
    com.require_length_match(value, self.index)
  File "d:\ANACONDA\envs\merlion\lib\site-packages\pandas\core\common.py", line 573, in require_length_match
    raise ValueError(
ValueError: Length of values (19998) does not match length of index (9999)
或者:
!python E:/Merlion/benchmark_forecast.py --model AutoETS --dataset CustomDataset --data_root E:/Merlion/data/walmart/walmart_mini_error.csv --data_kwargs "{\"test_frac\": 0.25, \"index_cols\": [\"Store\", \"Dept\"], \"data_cols\": [\"Weekly_Sales\"]}"
2024-10-10 23:44:19,126 (resample:121) WARNING: Inferred granularity <Week: weekday=4>
2024-10-10 23:44:20,030 (resample:121) WARNING: Inferred granularity <Week: weekday=4>
2024-10-10 23:44:20,136 (base:216) INFO: Best model: ETS(err=add,trend=None,seas=None,damped=False)
ForecastEvaluator:   0%|          | 0/1209600 [00:00<?, ?it/s][A
ForecastEvaluator: 100%|██████████| 1209600/1209600 [00:00<00:00, 60467082.84it/s]
CustomDataset\walmart Dataset:  14%|█▍        | 1/7 [00:00<00:04,  1.22it/s]E:\Merlion\merlion\models\forecast\ets.py:145: FutureWarning: Series.__getitem__ treating keys as positions is deprecated. In a future version, integer keys will always be treated as labels (consistent with DataFrame behavior). To access a value by position, use `ser.iloc[pos]`
  self._last_val = train_data[-1]
Traceback (most recent call last):
  File "E:\Merlion\benchmark_forecast.py", line 532, in <module>
    main()
  File "E:\Merlion\benchmark_forecast.py", line 472, in main
    train_model(
  File "E:\Merlion\benchmark_forecast.py", line 268, in train_model
    dt = infer_granularity(vals.time_stamps)
  File "E:\Merlion\merlion\utils\resample.py", line 148, in infer_granularity
    raise ValueError("Need at least 2 timestamps to infer a granularity.")
ValueError: Need at least 2 timestamps to infer a granularity.
在上述示例中,将data_cols指定为Weekly_Sales。这表示我们建模的唯一列是Weekly_Sales。如果想进行多变量预测,还可以添加Temperature、Fuel_Price、CPI等。我们将第一个数据列视为希望预测的目标单变量。
原文地址:https://blog.csdn.net/m0_56676945/article/details/142847754
免责声明:本站文章内容转载自网络资源,如本站内容侵犯了原著者的合法权益,可联系本站删除。更多内容请关注自学内容网(zxcms.com)!